 7
7peptides
spectra
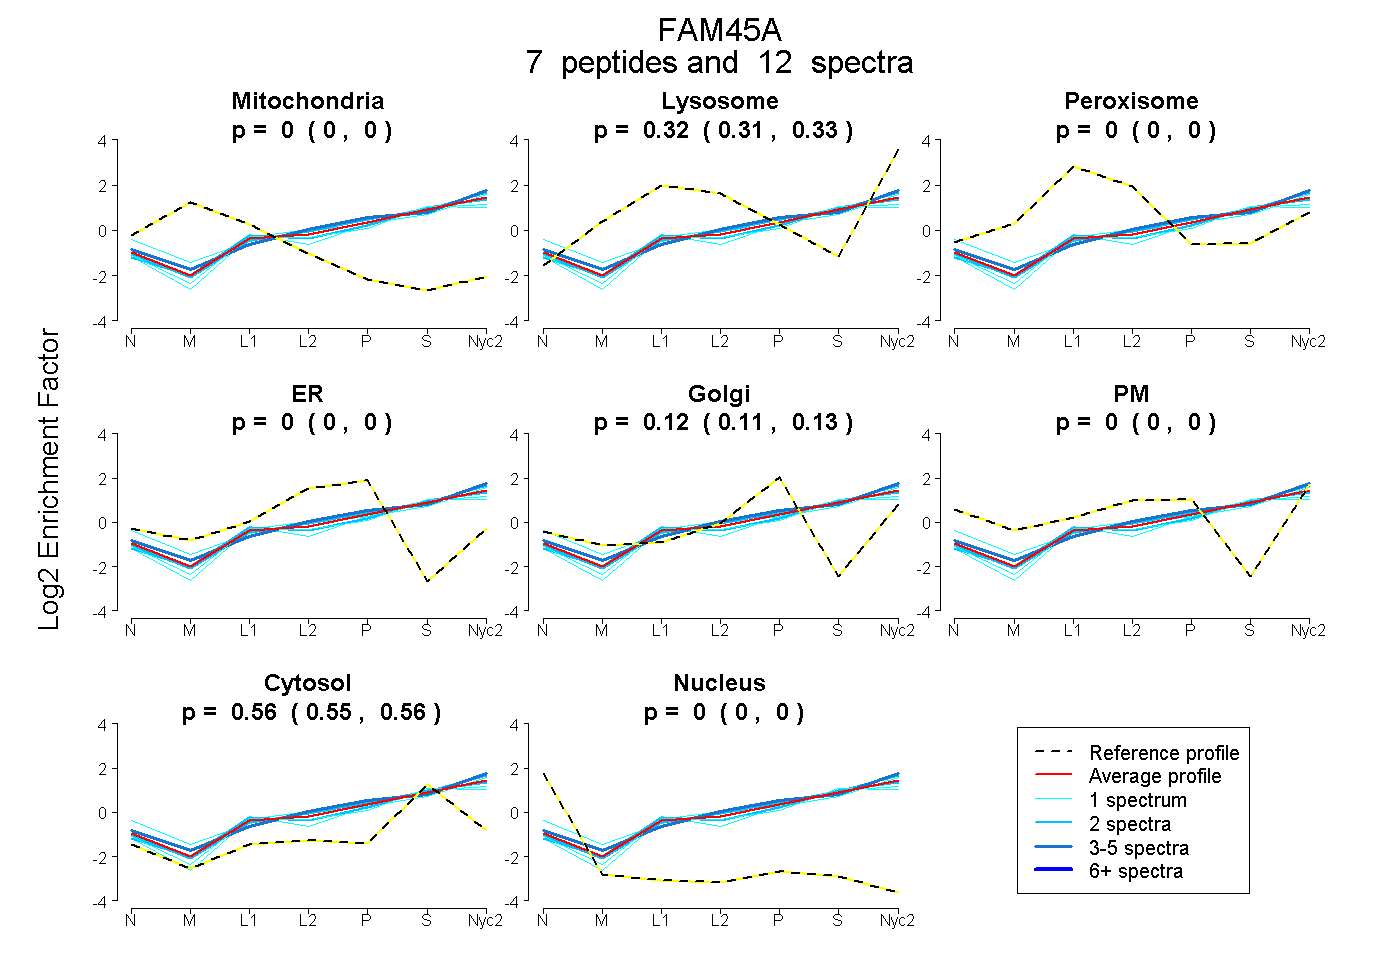
0.000 | 0.000
0.312 | 0.331
0.000 | 0.000
0.000 | 0.000
0.110 | 0.129
0.000 | 0.000
0.549 | 0.563
0.000 | 0.000
2peptides
spectra
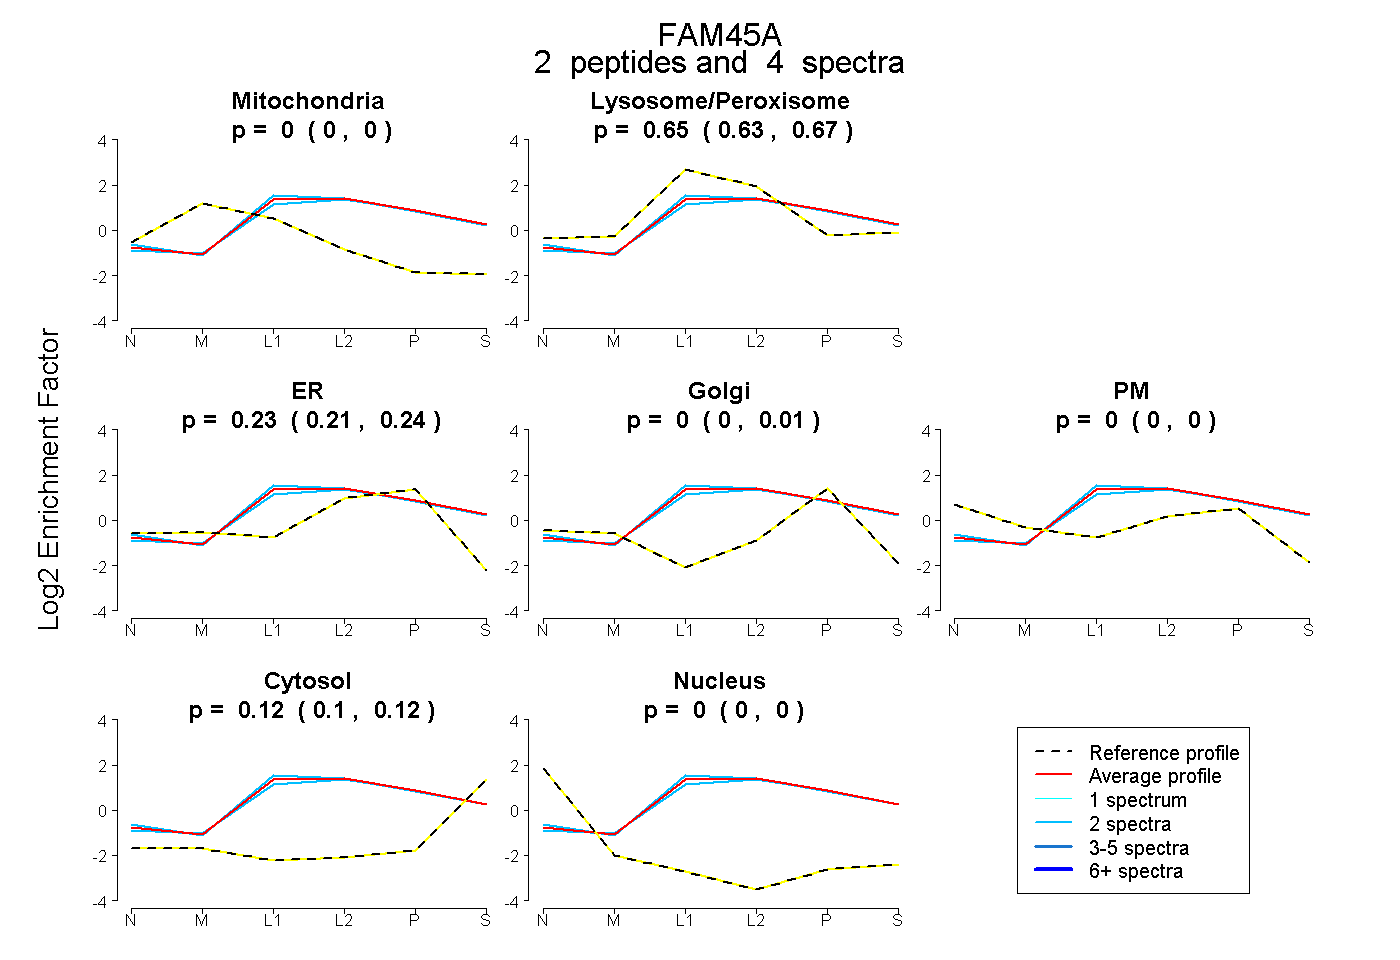
0.000 | 0.000
0.632 | 0.672
0.207 | 0.244
0.000 | 0.008
0.000 | 0.000
0.105 | 0.123
0.000 | 0.000
6peptides
spectra
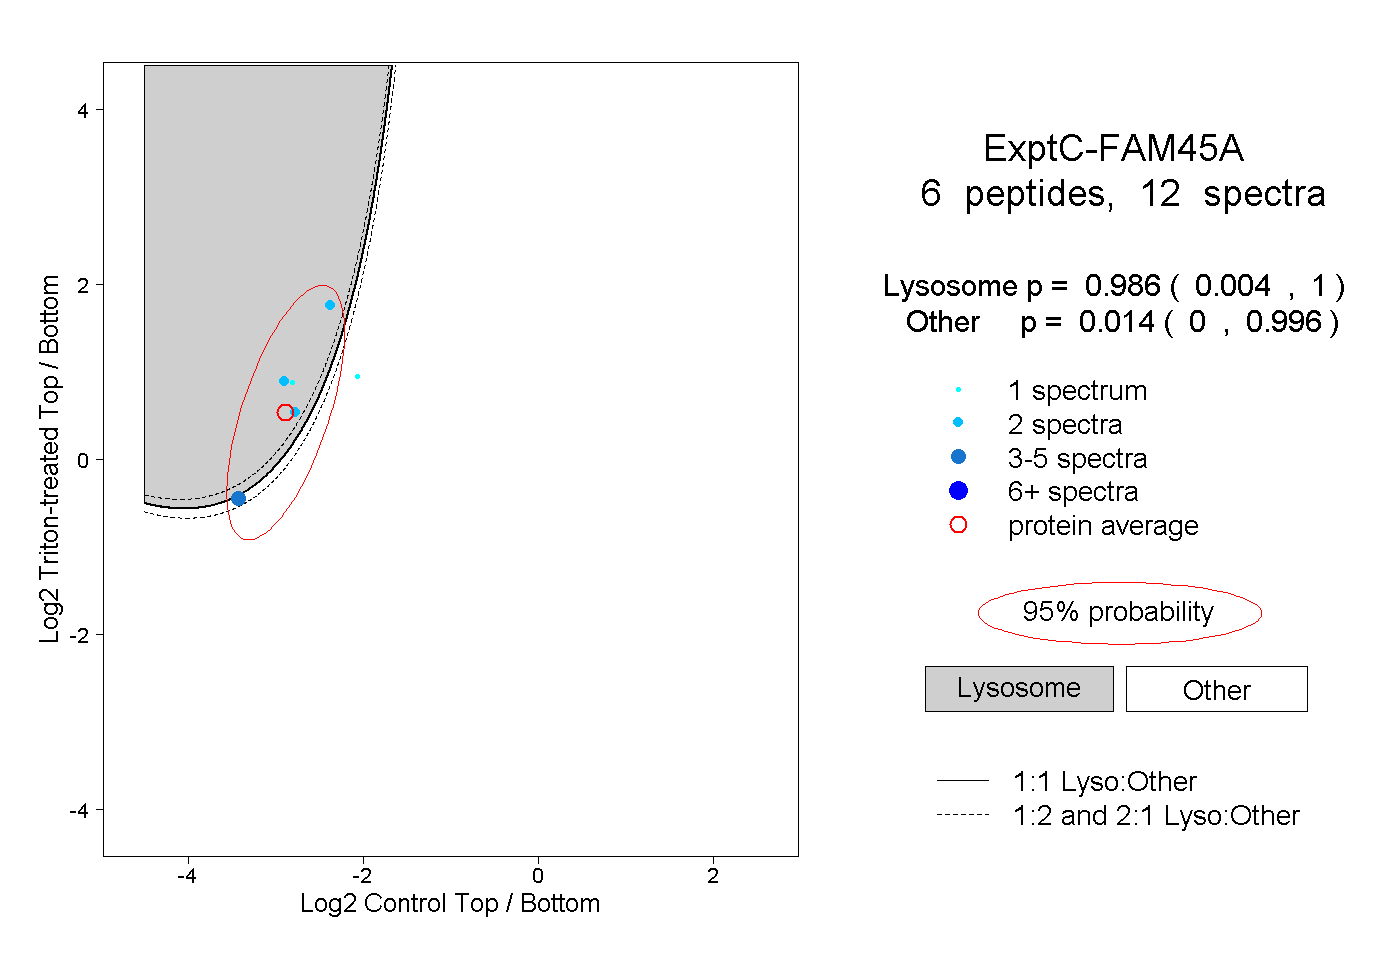
0.004 | 1.000
0.000 | 0.996
3peptides
spectra
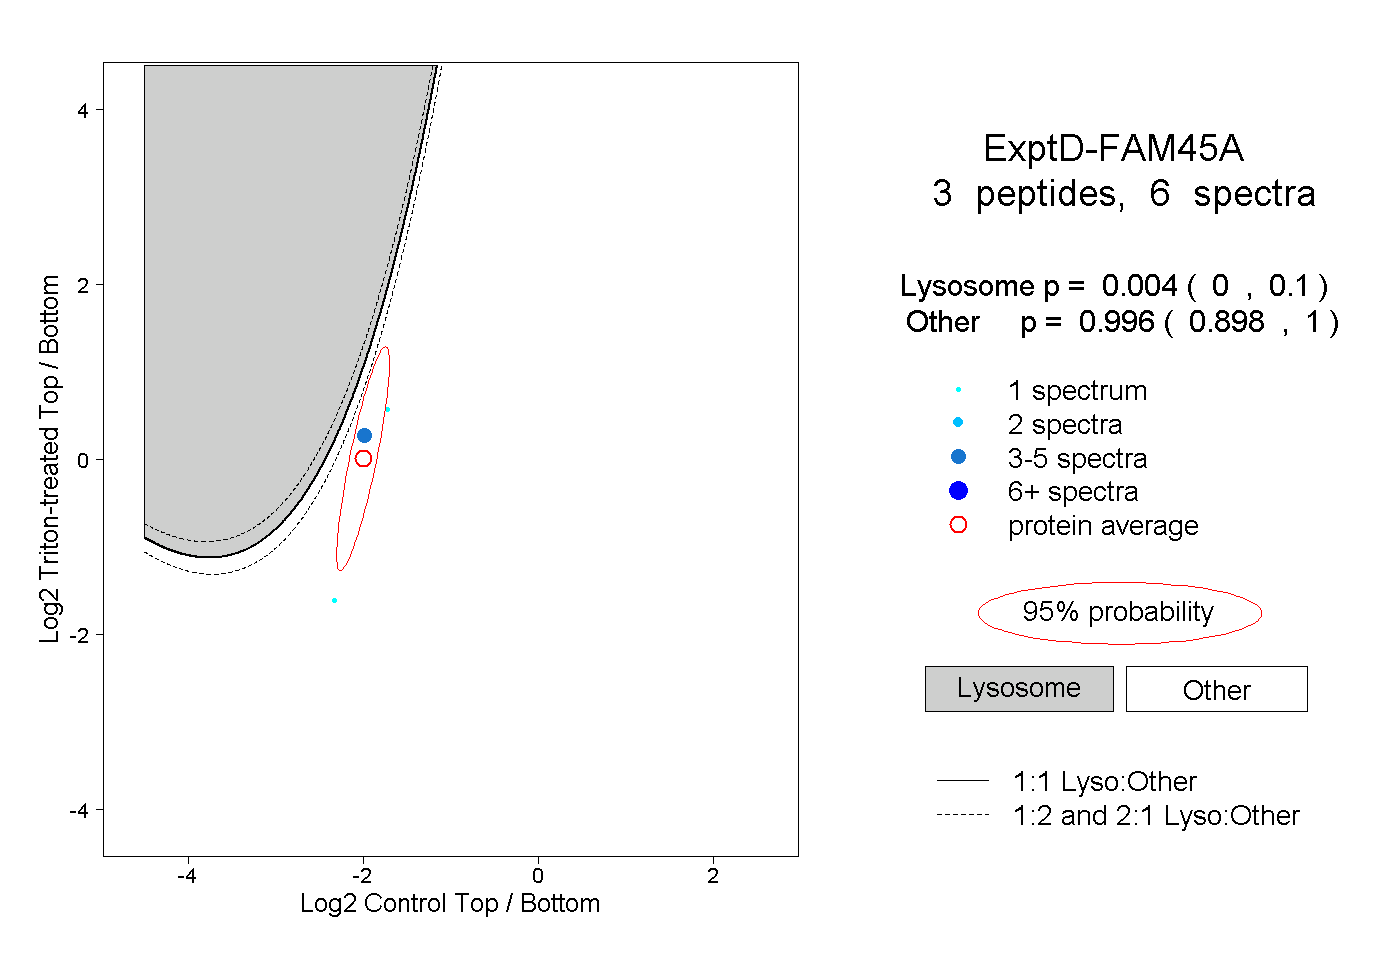
0.000 | 0.100
0.898 | 1.000