 7
7peptides
spectra
0.000 | 0.000
0.312 | 0.331
0.000 | 0.000
0.000 | 0.000
0.110 | 0.129
0.000 | 0.000
0.549 | 0.563
0.000 | 0.000
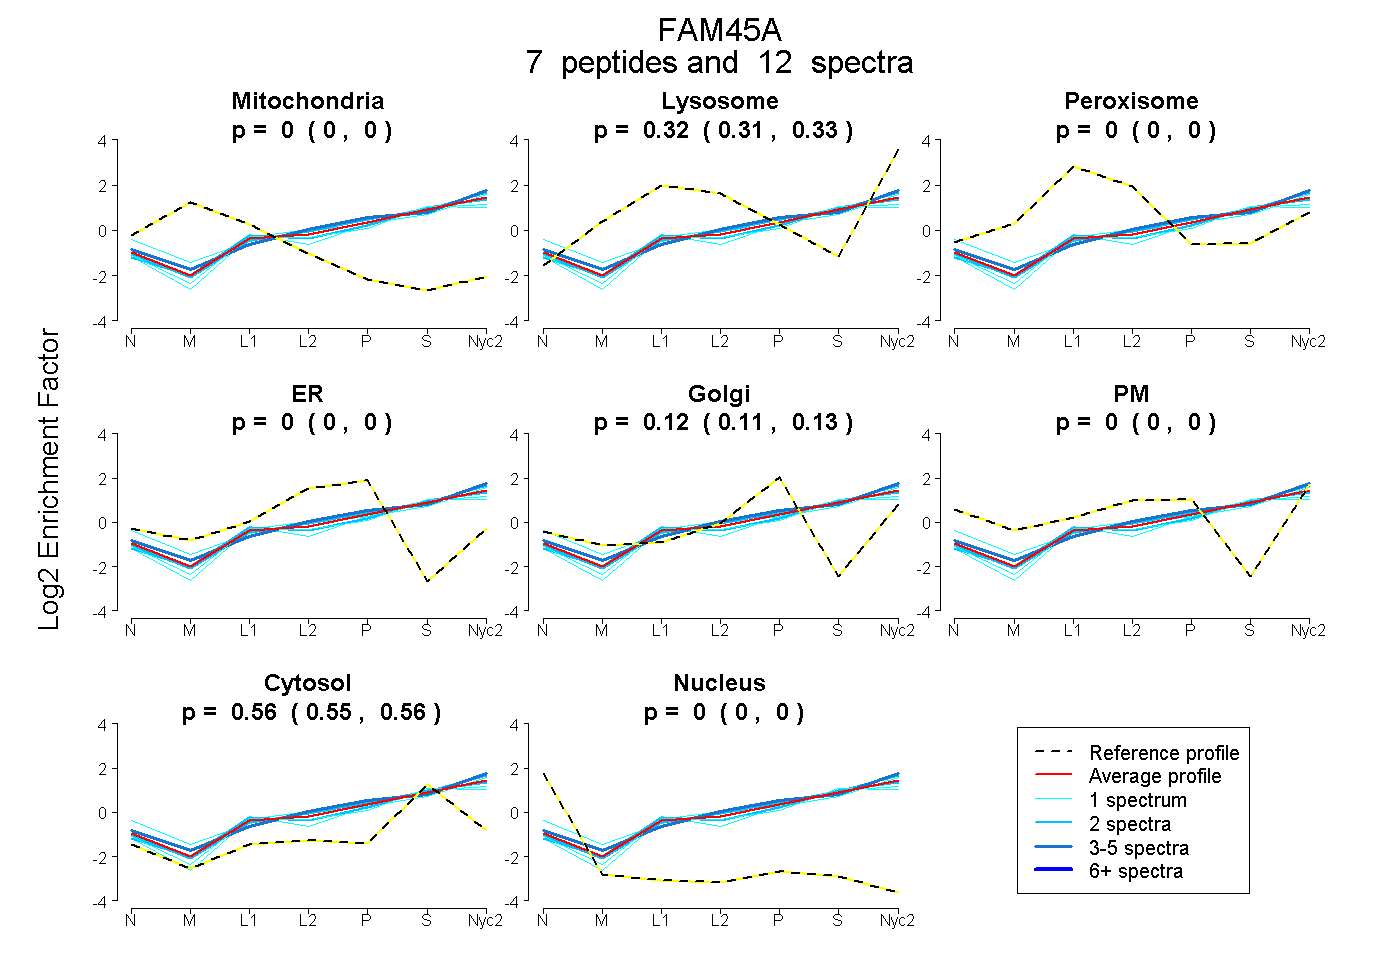
| Plot | Mito | Lyso | Perox | ER | Golgi | PM | Cytosol | Nucleus | |||||
| Expt A |
7 peptides |
12 spectra |
|
0.000 0.000 | 0.000 |
0.323 0.312 | 0.331 |
0.000 0.000 | 0.000 |
0.000 0.000 | 0.000 |
0.120 0.110 | 0.129 |
0.000 0.000 | 0.000 |
0.557 0.549 | 0.563 |
0.000 0.000 | 0.000 |
| 1 spectrum, GICQSEENGSFLSR | 0.000 | 0.288 | 0.000 | 0.000 | 0.113 | 0.000 | 0.599 | 0.000 | ||
| 1 spectrum, EIGQLIVQSAEDPEK | 0.000 | 0.324 | 0.000 | 0.000 | 0.083 | 0.000 | 0.593 | 0.000 | ||
| 2 spectra, IEAVQEFTR | 0.000 | 0.342 | 0.000 | 0.000 | 0.123 | 0.000 | 0.535 | 0.000 | ||
| 2 spectra, IVVYHPK | 0.000 | 0.337 | 0.000 | 0.000 | 0.065 | 0.000 | 0.598 | 0.000 | ||
| 1 spectrum, VFLNVEALK | 0.000 | 0.286 | 0.000 | 0.000 | 0.070 | 0.000 | 0.645 | 0.000 | ||
| 1 spectrum, DFDGR | 0.000 | 0.257 | 0.000 | 0.000 | 0.005 | 0.233 | 0.505 | 0.000 | ||
| 4 spectra, TLPALVWHR | 0.000 | 0.336 | 0.000 | 0.000 | 0.178 | 0.000 | 0.486 | 0.000 |
| Plot | Mito | Lyso or Perox | ER | Golgi | PM | Cytosol | Nucleus | ||||||
| Expt B |
2 peptides |
4 spectra |
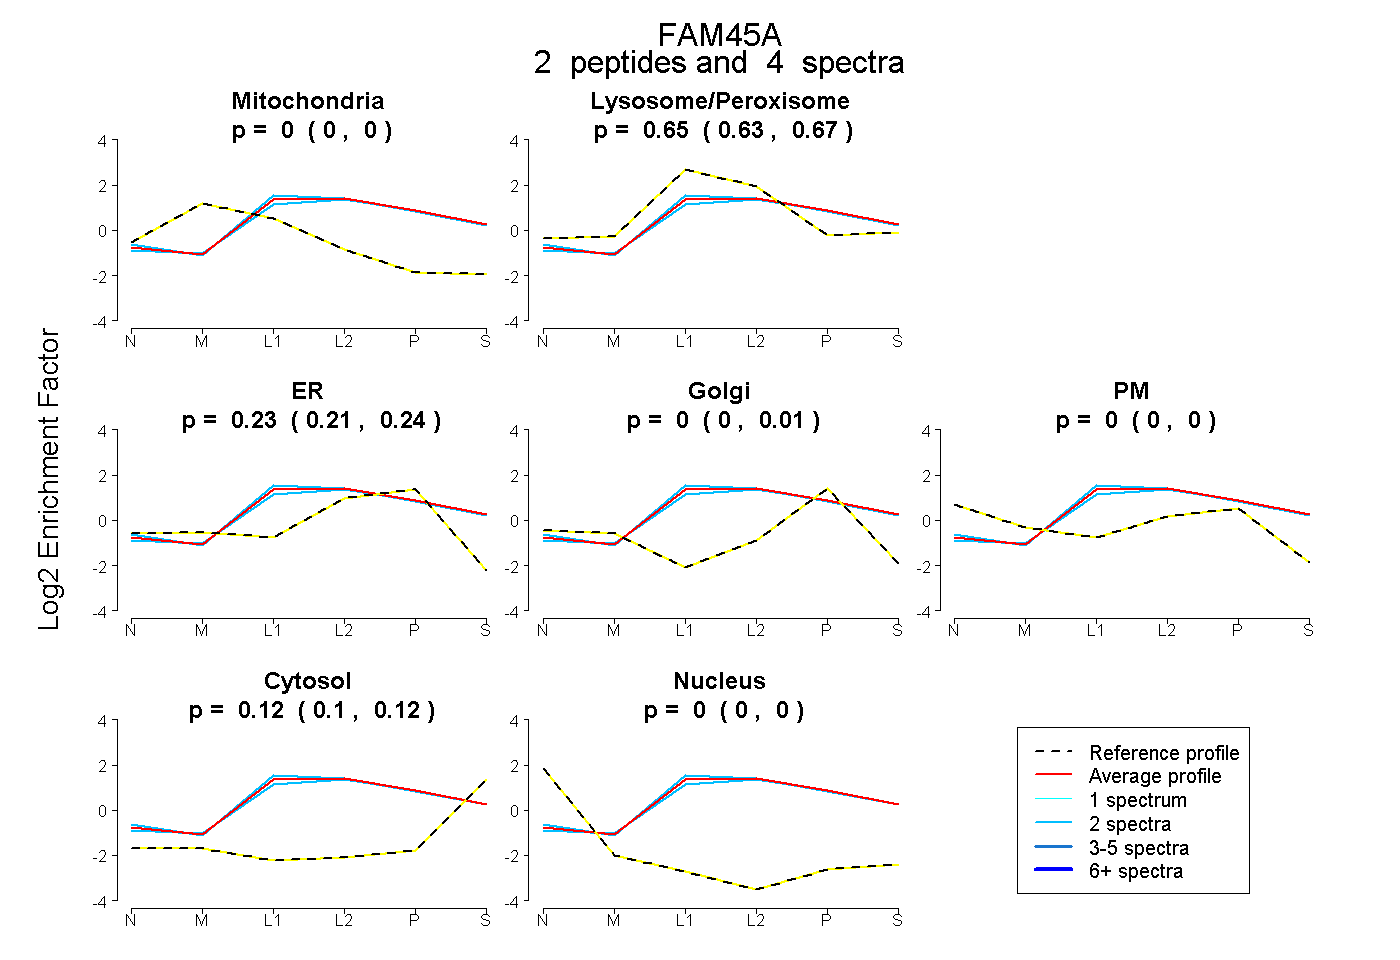 |
0.000 0.000 | 0.000 |
0.653 0.632 | 0.672 |
0.232 0.207 | 0.244 |
0.000 0.000 | 0.008 |
0.000 0.000 | 0.000 |
0.116 0.105 | 0.123 |
0.000 0.000 | 0.000 |
|||
| Plot | Lyso | Other | |||||||||||
| Expt C |
6 peptides |
12 spectra |
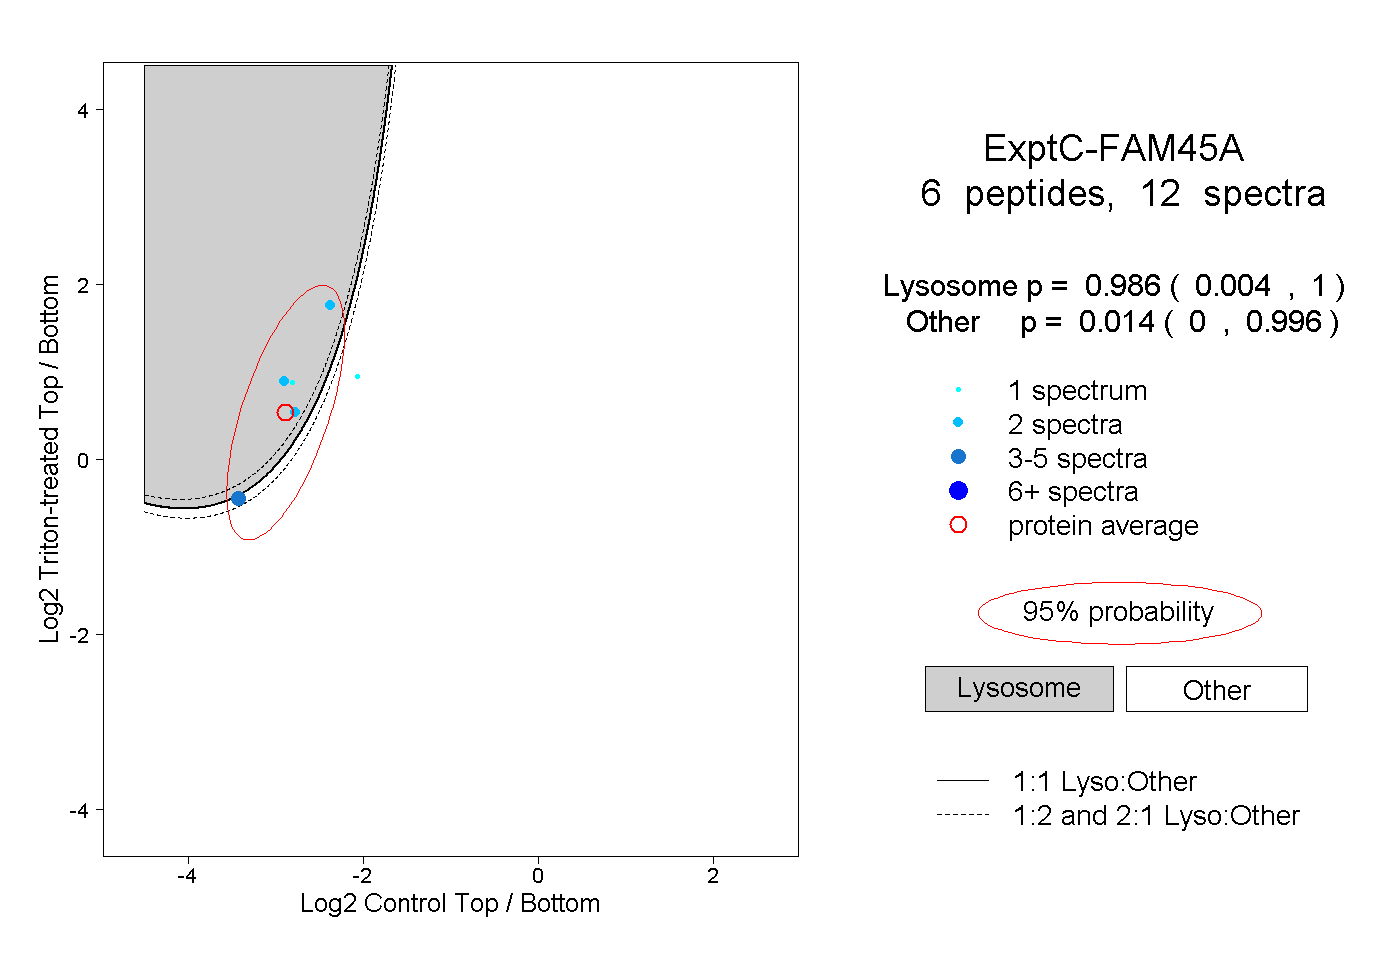 |
0.986 0.004 | 1.000 |
0.014 0.000 | 0.996 |
||||||||
| Plot | Lyso | Other | |||||||||||
| Expt D |
3 peptides |
6 spectra |
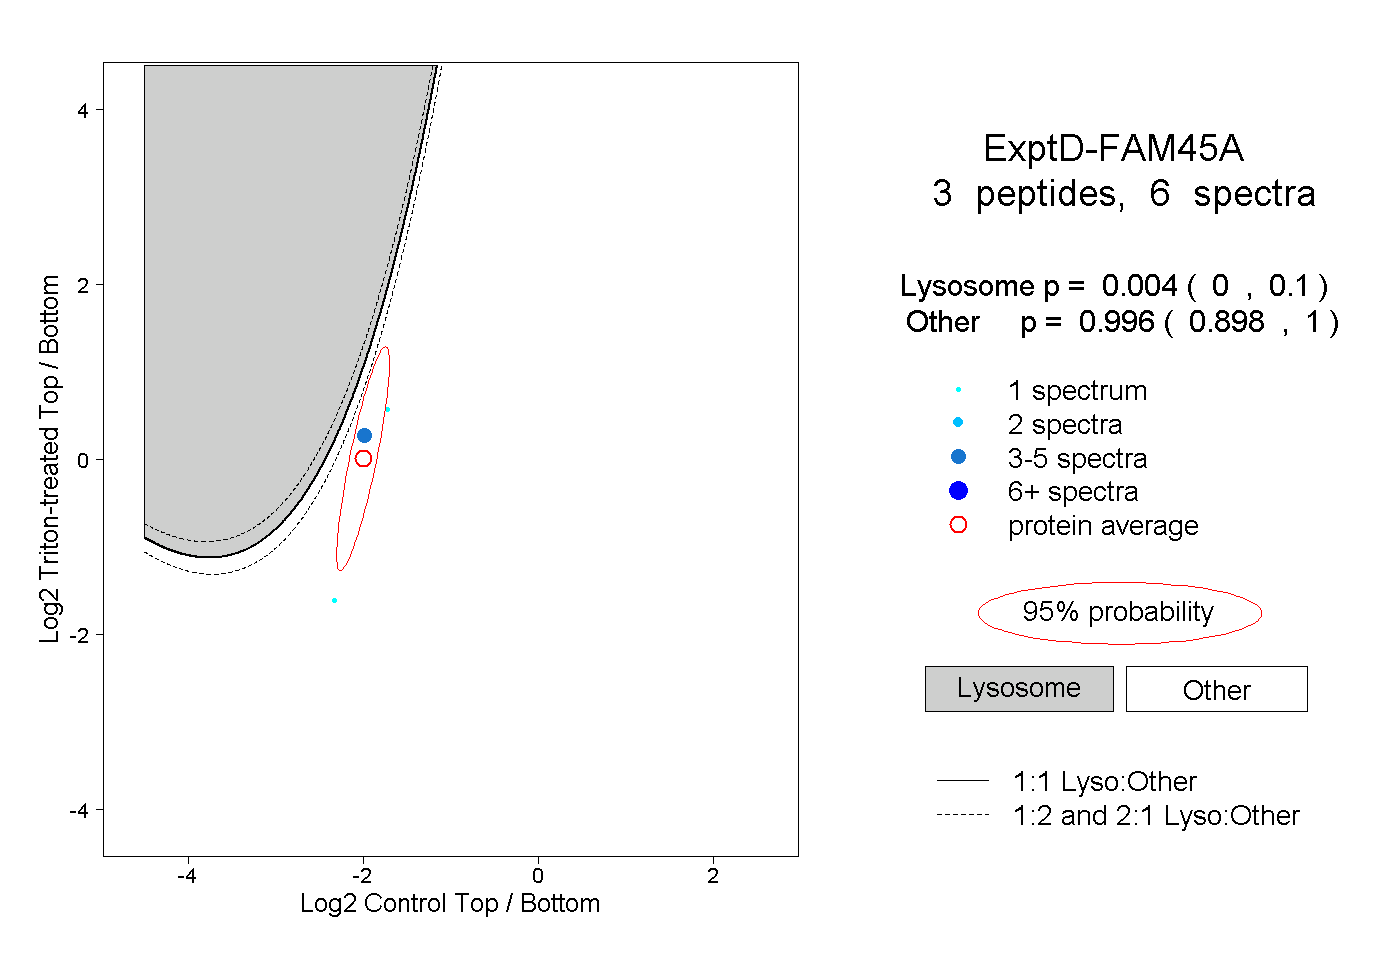 |
0.004 0.000 | 0.100 |
0.996 0.898 | 1.000 |