 15
15peptides
spectra
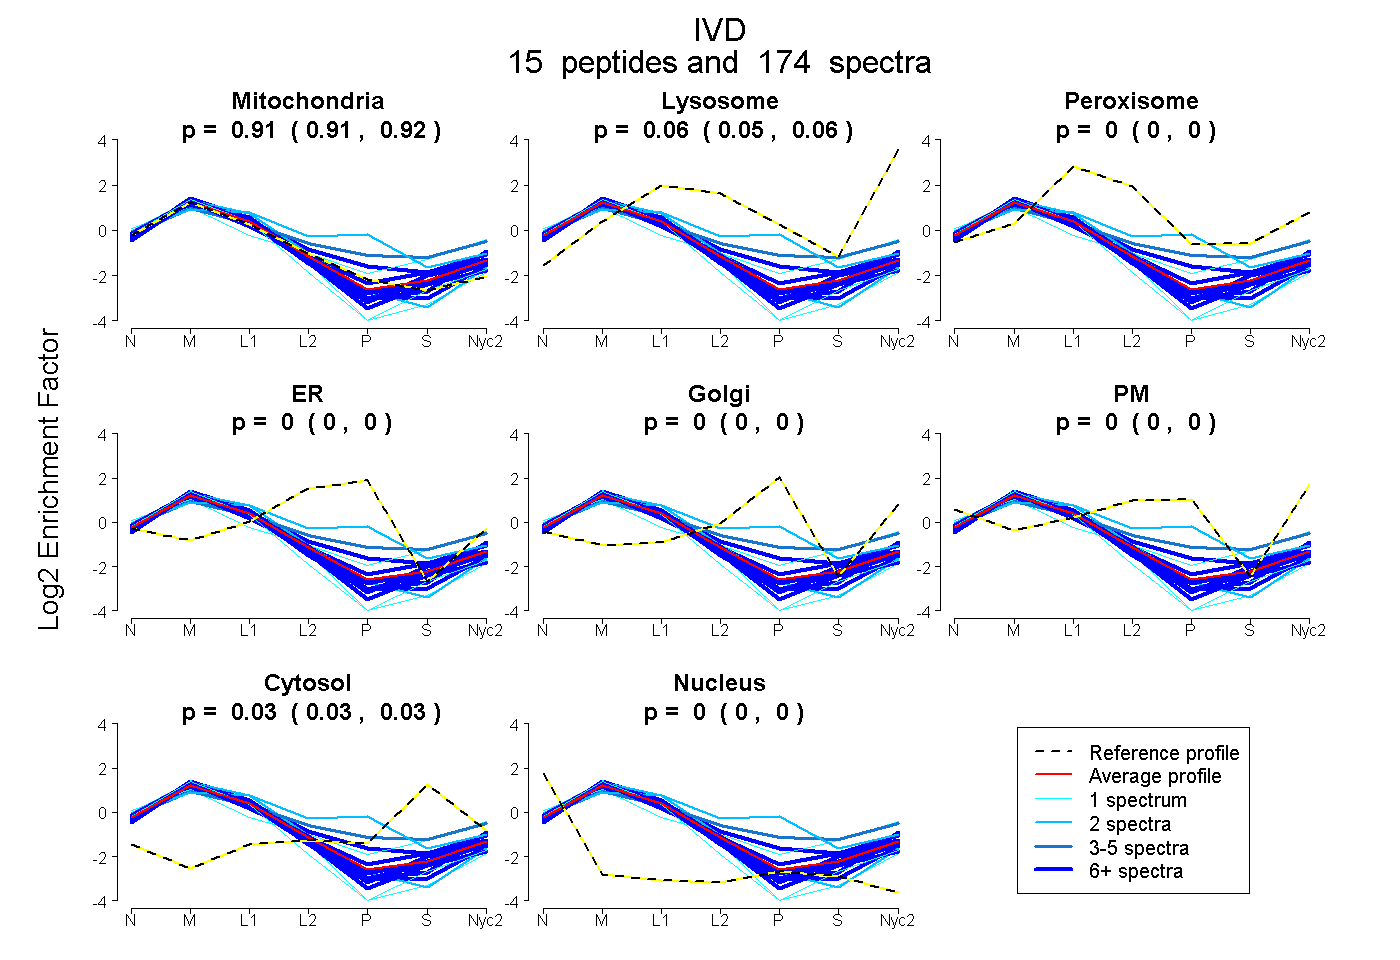
0.910 | 0.915
0.054 | 0.058
0.000 | 0.000
0.000 | 0.000
0.000 | 0.000
0.000 | 0.000
0.029 | 0.033
0.000 | 0.000
15peptides
spectra
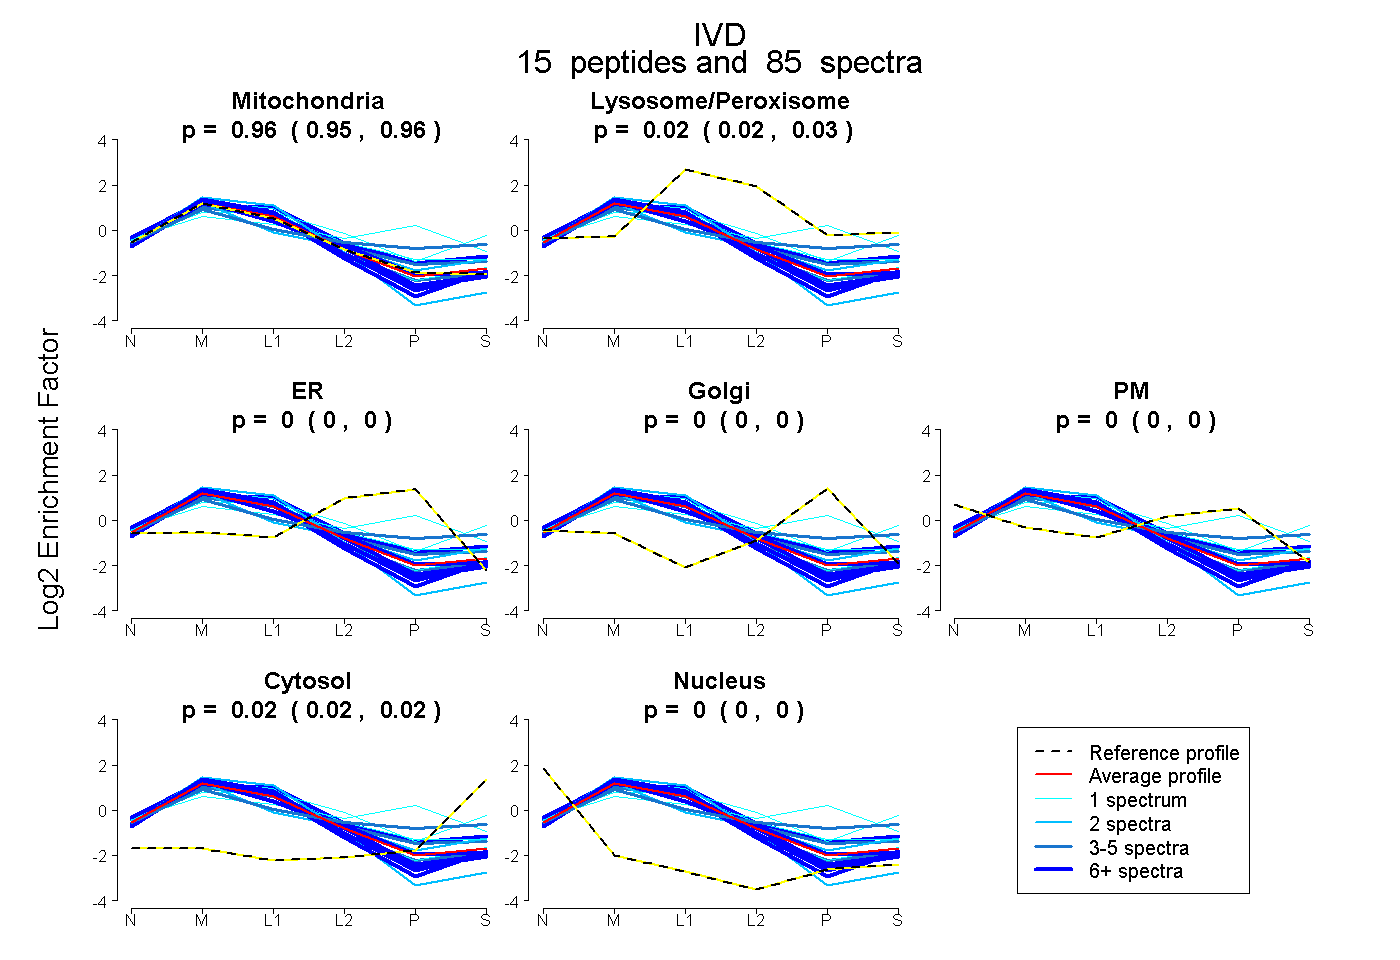
0.951 | 0.964
0.017 | 0.026
0.000 | 0.000
0.000 | 0.000
0.000 | 0.000
0.017 | 0.023
0.000 | 0.000
19peptides
spectra
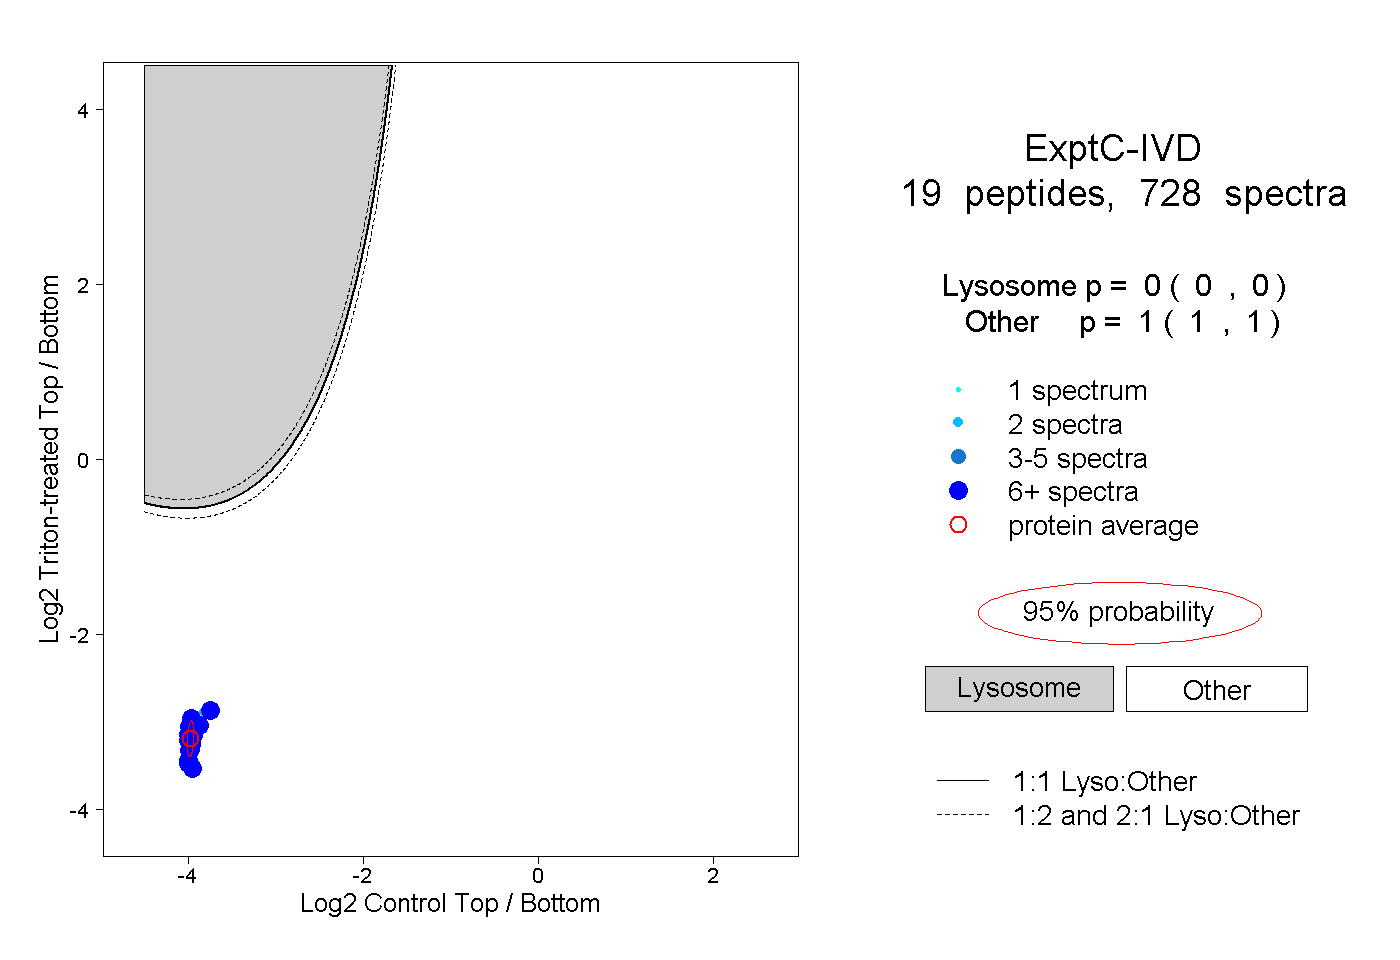
0.000 | 0.000
1.000 | 1.000
11peptides
spectra
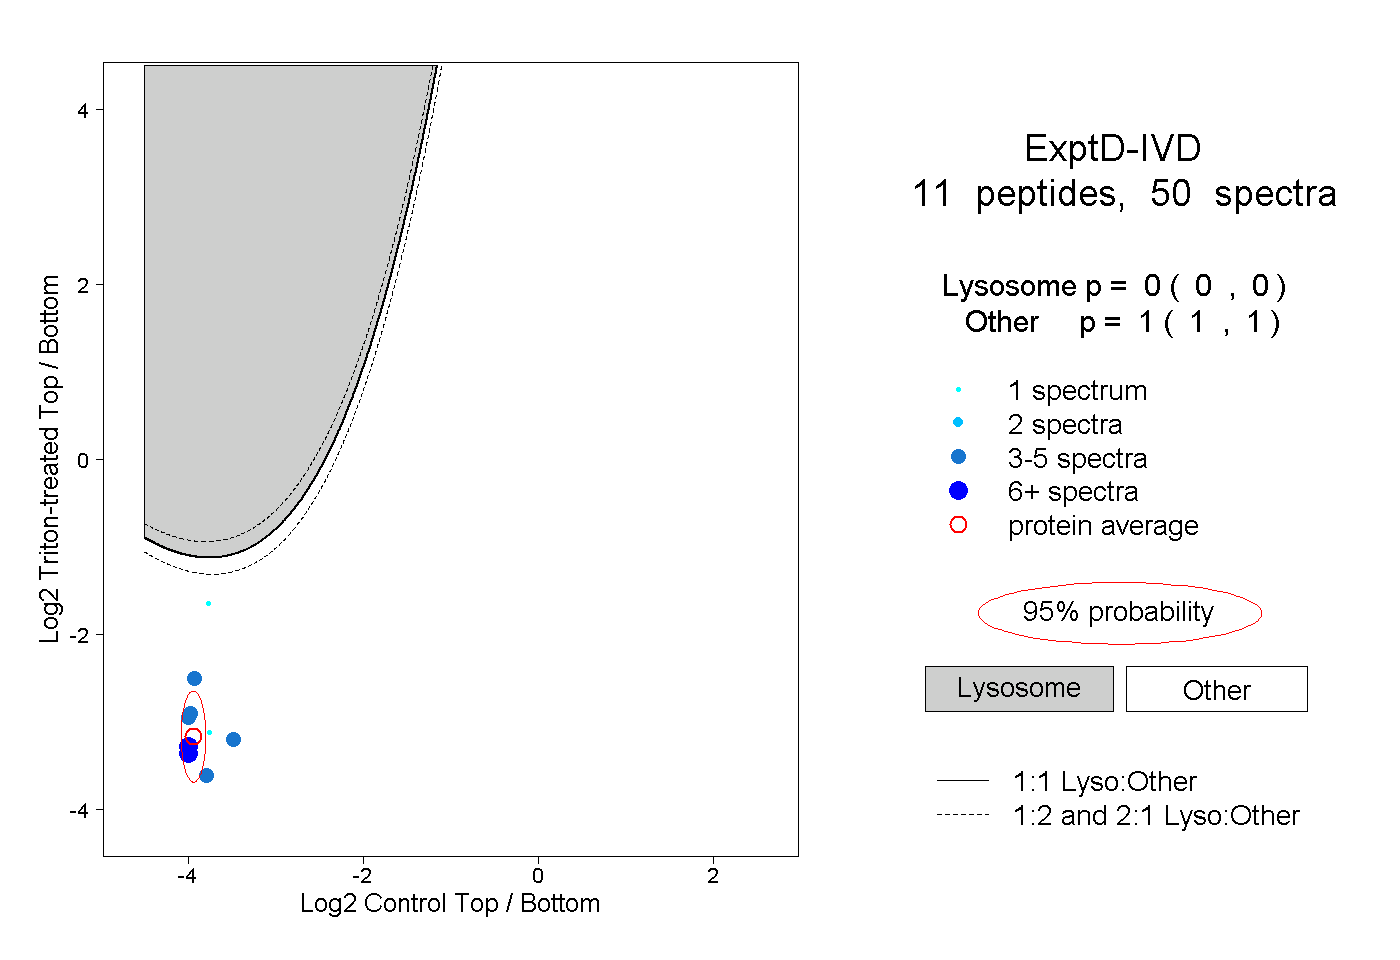
0.000 | 0.000
1.000 | 1.000