 15
15peptides
spectra
0.910 | 0.915
0.054 | 0.058
0.000 | 0.000
0.000 | 0.000
0.000 | 0.000
0.000 | 0.000
0.029 | 0.033
0.000 | 0.000
| Plot | Mito | Lyso | Perox | ER | Golgi | PM | Cytosol | Nucleus | |||||
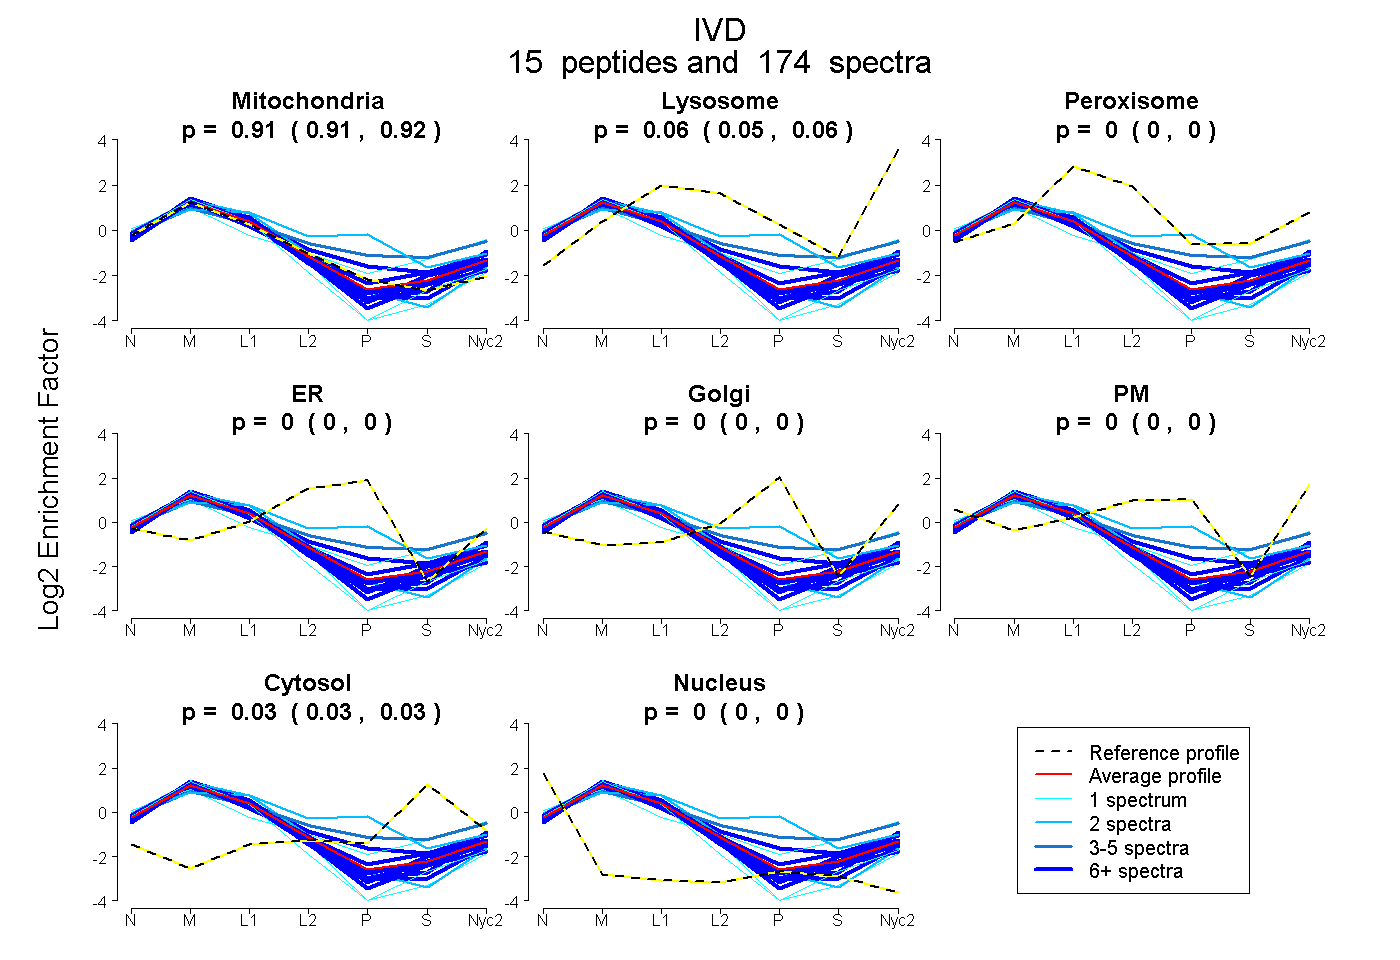
| Expt A |
15 peptides |
174 spectra |
|
0.913 0.910 | 0.915 |
0.056 0.054 | 0.058 |
0.000 0.000 | 0.000 |
0.000 0.000 | 0.000 |
0.000 0.000 | 0.000 |
0.000 0.000 | 0.000 |
0.032 0.029 | 0.033 |
0.000 0.000 | 0.000 |
| 7 spectra, AFNADFR | 0.832 | 0.094 | 0.000 | 0.000 | 0.000 | 0.000 | 0.074 | 0.000 | ||
| 50 spectra, TDLTAVPASR | 0.983 | 0.000 | 0.000 | 0.000 | 0.000 | 0.000 | 0.000 | 0.017 | ||
| 1 spectrum, FVQENLAPK | 0.637 | 0.175 | 0.000 | 0.000 | 0.000 | 0.000 | 0.153 | 0.035 | ||
| 20 spectra, MADMYTR | 0.923 | 0.038 | 0.000 | 0.000 | 0.000 | 0.000 | 0.039 | 0.000 | ||
| 14 spectra, LYEIGGGTSEVR | 0.927 | 0.037 | 0.000 | 0.000 | 0.000 | 0.000 | 0.036 | 0.000 | ||
| 22 spectra, QYVYNVAR | 0.975 | 0.005 | 0.000 | 0.000 | 0.000 | 0.000 | 0.019 | 0.000 | ||
| 6 spectra, DMPGFSTSK | 1.000 | 0.000 | 0.000 | 0.000 | 0.000 | 0.000 | 0.000 | 0.000 | ||
| 7 spectra, IGQFQLMQGK | 0.925 | 0.075 | 0.000 | 0.000 | 0.000 | 0.000 | 0.000 | 0.000 | ||
| 11 spectra, GVYVLMSGLDLER | 0.922 | 0.000 | 0.025 | 0.000 | 0.000 | 0.000 | 0.054 | 0.000 | ||
| 25 spectra, AQEIDQSNDFK | 0.766 | 0.030 | 0.085 | 0.000 | 0.000 | 0.051 | 0.069 | 0.000 | ||
| 2 spectra, LRPLPSPLAVPQR | 0.509 | 0.000 | 0.236 | 0.056 | 0.199 | 0.000 | 0.000 | 0.000 | ||
| 5 spectra, GSNTCELVFEDCK | 0.567 | 0.142 | 0.061 | 0.000 | 0.000 | 0.086 | 0.144 | 0.000 | ||
| 1 spectrum, FWITNGPDADVLVVYAK | 0.969 | 0.000 | 0.000 | 0.000 | 0.000 | 0.000 | 0.000 | 0.031 | ||
| 2 spectra, GITAFIVEK | 0.995 | 0.005 | 0.000 | 0.000 | 0.000 | 0.000 | 0.000 | 0.000 | ||
| 1 spectrum, VPAANILSQESK | 0.965 | 0.000 | 0.000 | 0.000 | 0.000 | 0.000 | 0.000 | 0.035 |
| Plot | Mito | Lyso or Perox | ER | Golgi | PM | Cytosol | Nucleus | ||||||
| Expt B |
15 peptides |
85 spectra |
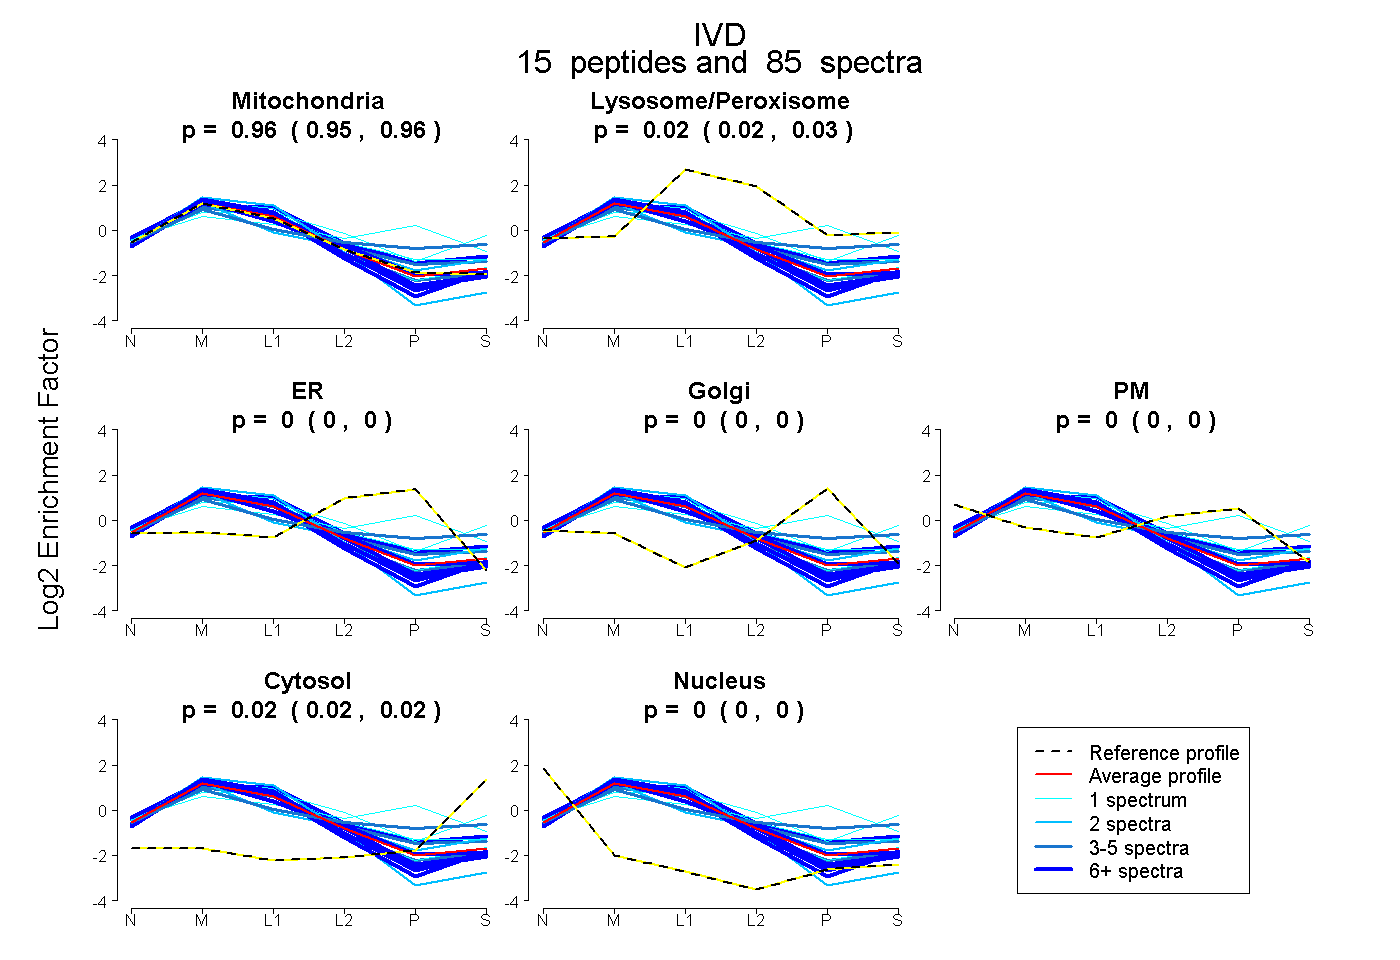 |
0.958 0.951 | 0.964 |
0.022 0.017 | 0.026 |
0.000 0.000 | 0.000 |
0.000 0.000 | 0.000 |
0.000 0.000 | 0.000 |
0.020 0.017 | 0.023 |
0.000 0.000 | 0.000 |
|||
| Plot | Lyso | Other | |||||||||||
| Expt C |
19 peptides |
728 spectra |
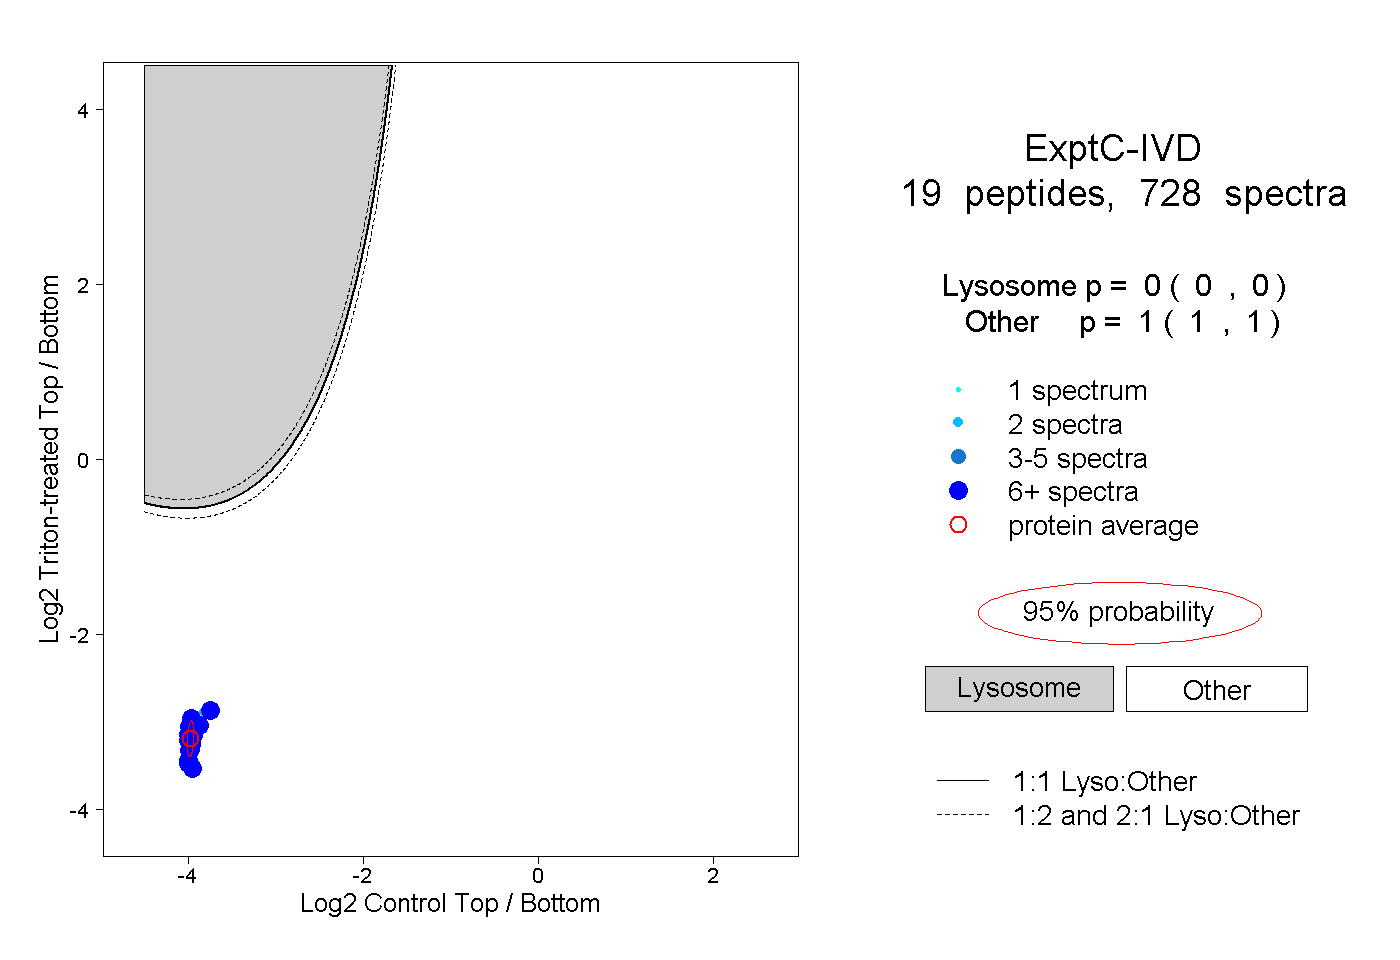 |
0.000 0.000 | 0.000 |
1.000 1.000 | 1.000 |
||||||||
| Plot | Lyso | Other | |||||||||||
| Expt D |
11 peptides |
50 spectra |
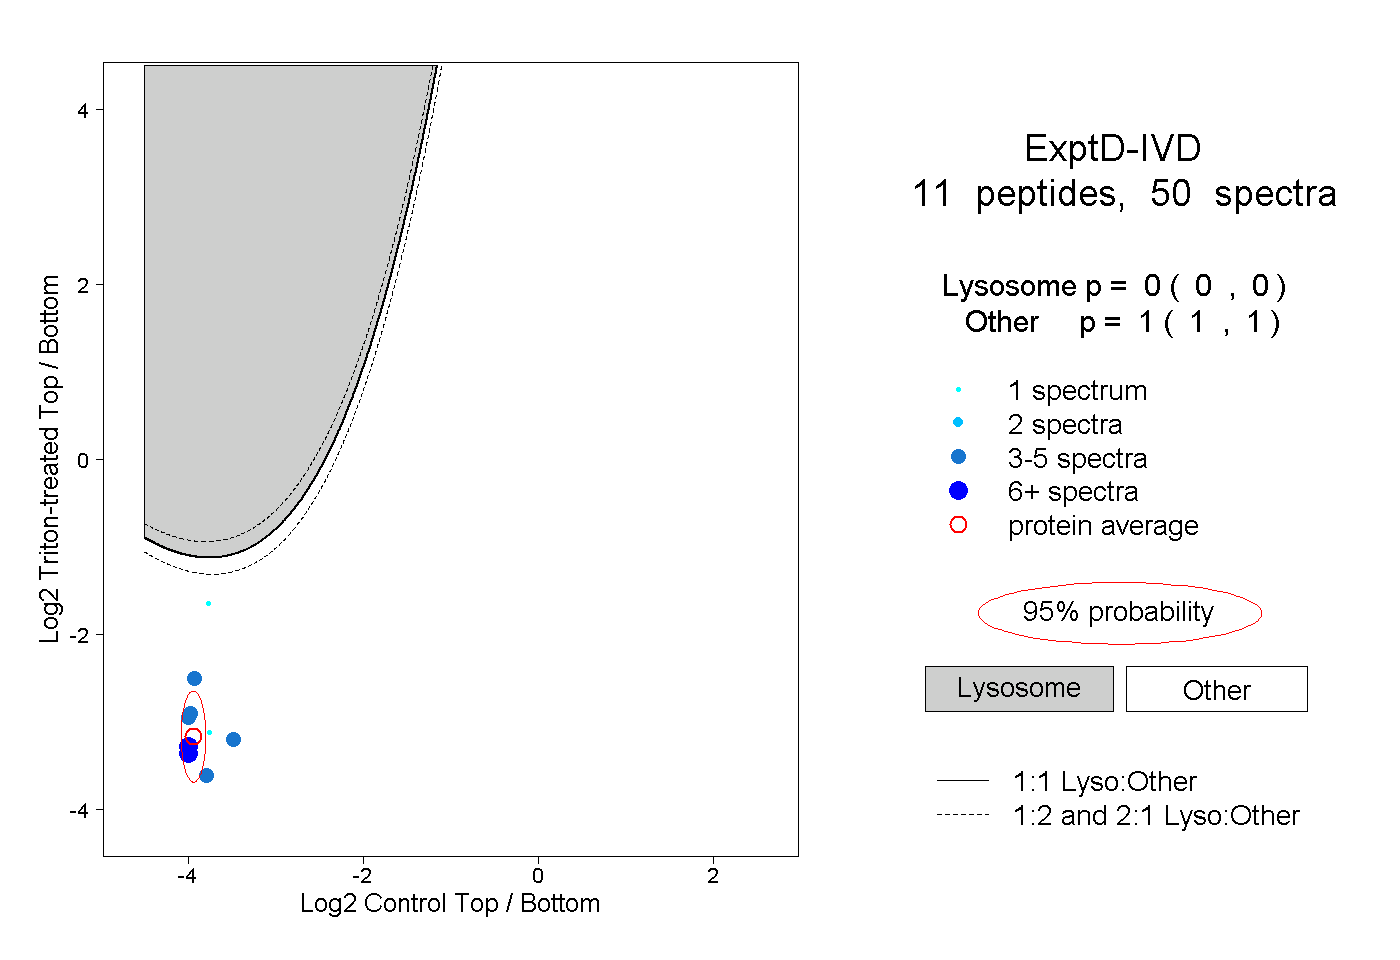 |
0.000 0.000 | 0.000 |
1.000 1.000 | 1.000 |