 3
3peptides
spectra
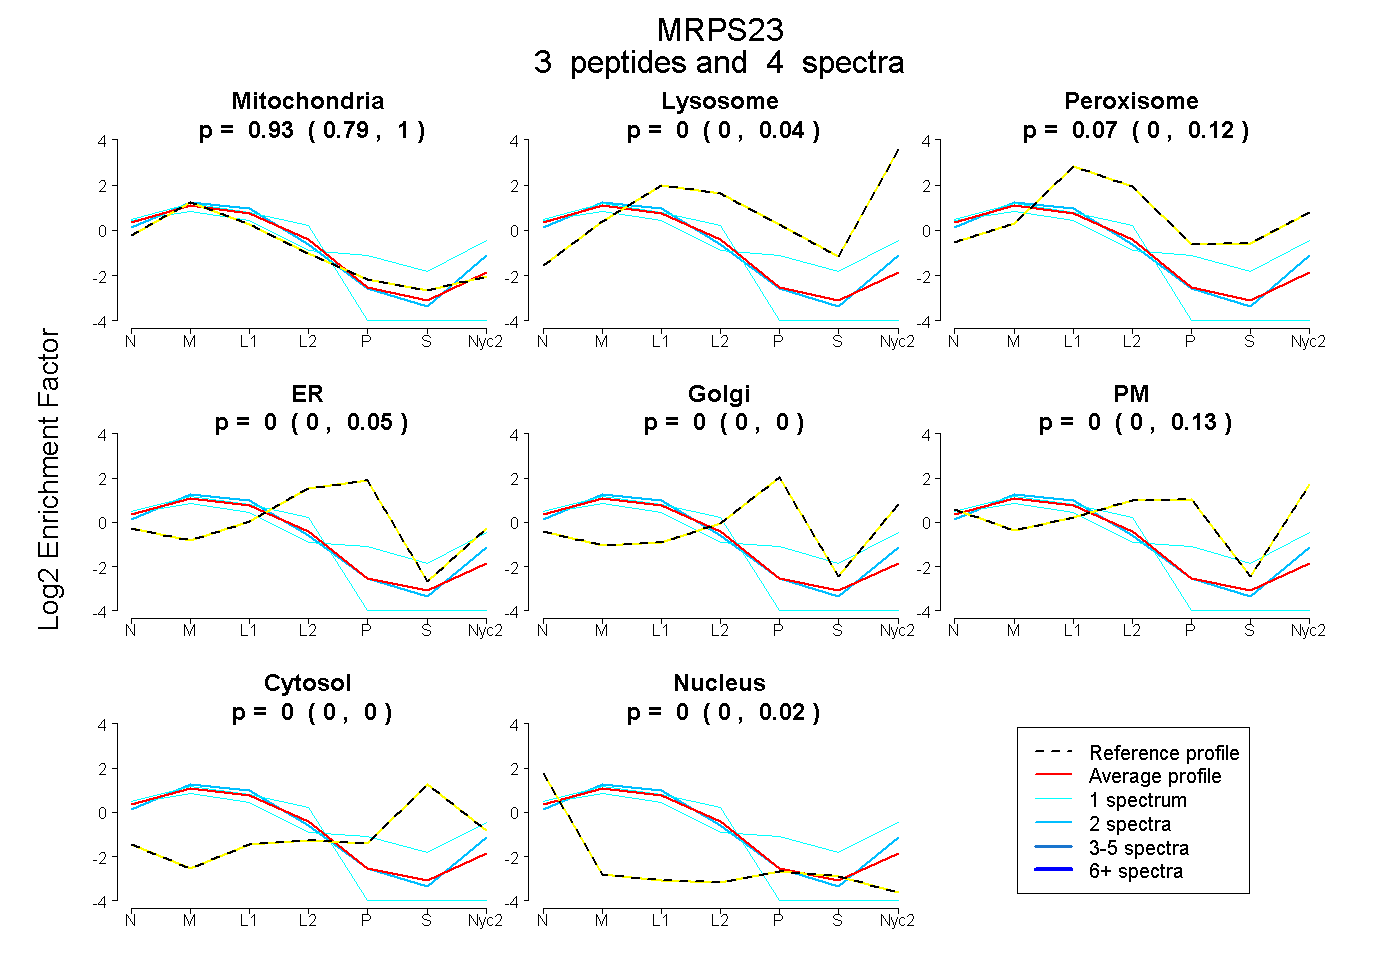
0.789 | 0.997
0.000 | 0.042
0.000 | 0.120
0.000 | 0.046
0.000 | 0.000
0.000 | 0.129
0.000 | 0.000
0.000 | 0.025
2peptides
spectra
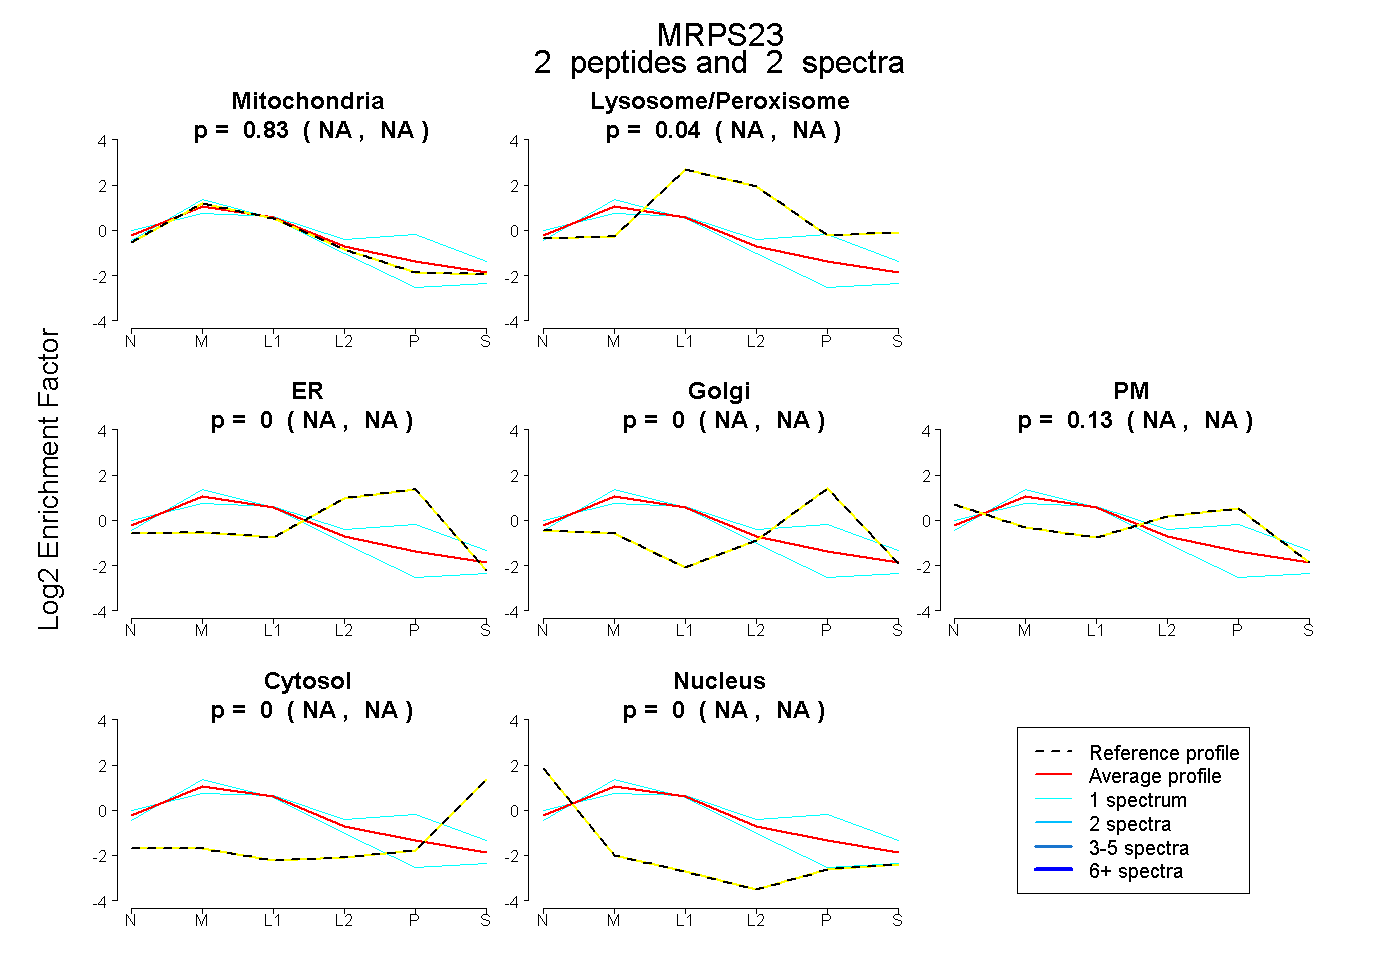
NA | NA
NA | NA
NA | NA
NA | NA
NA | NA
NA | NA
NA | NA
7peptides
spectra
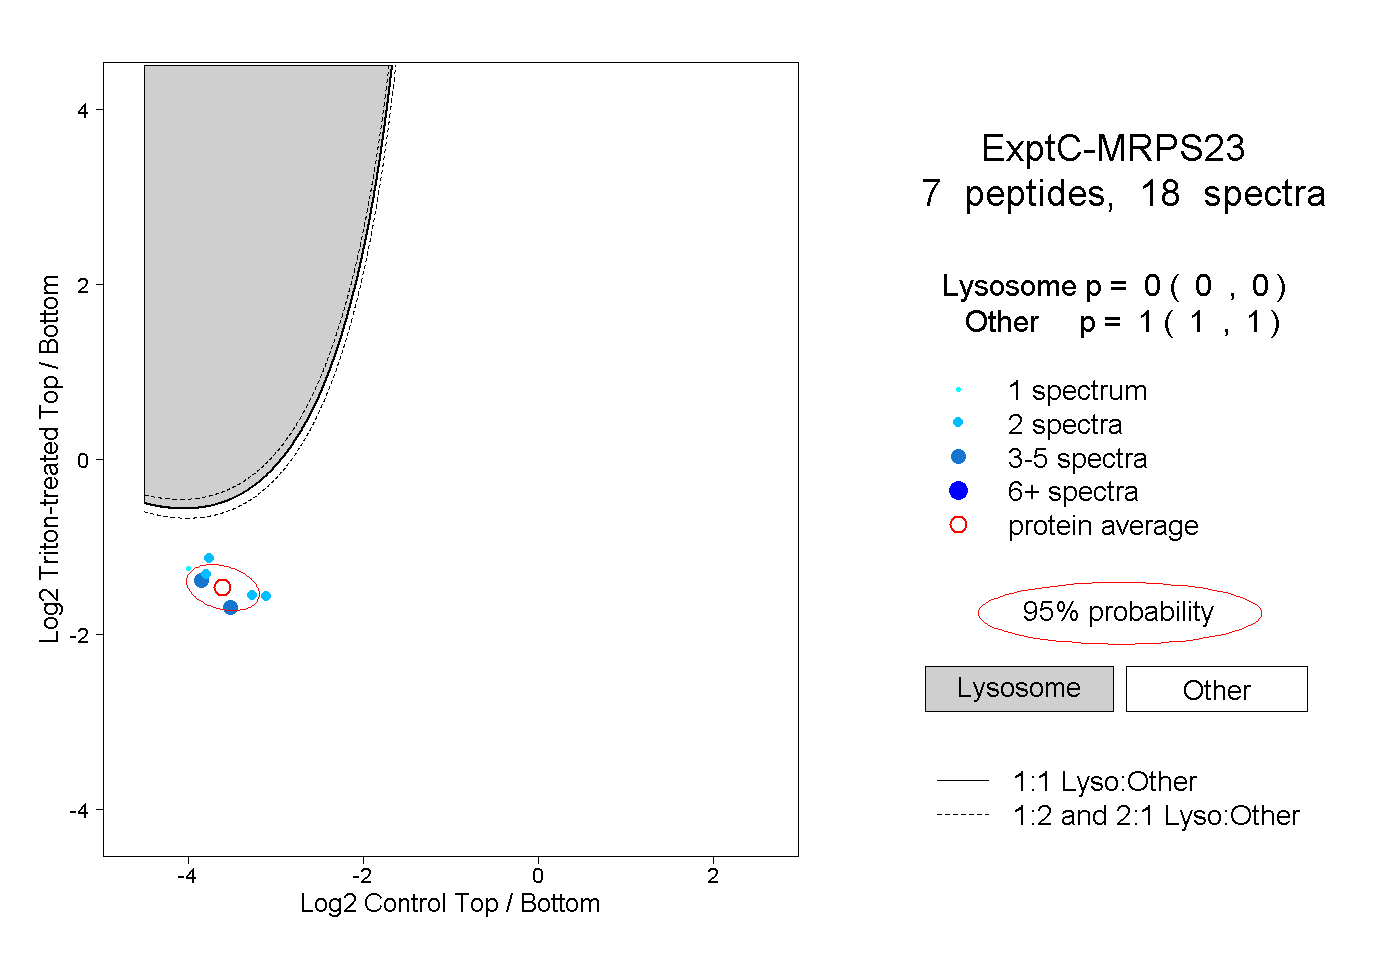
0.000 | 0.000
1.000 | 1.000