 3
3peptides
spectra
0.789 | 0.997
0.000 | 0.042
0.000 | 0.120
0.000 | 0.046
0.000 | 0.000
0.000 | 0.129
0.000 | 0.000
0.000 | 0.025
| Plot | Mito | Lyso | Perox | ER | Golgi | PM | Cytosol | Nucleus | |||||
| Expt A |
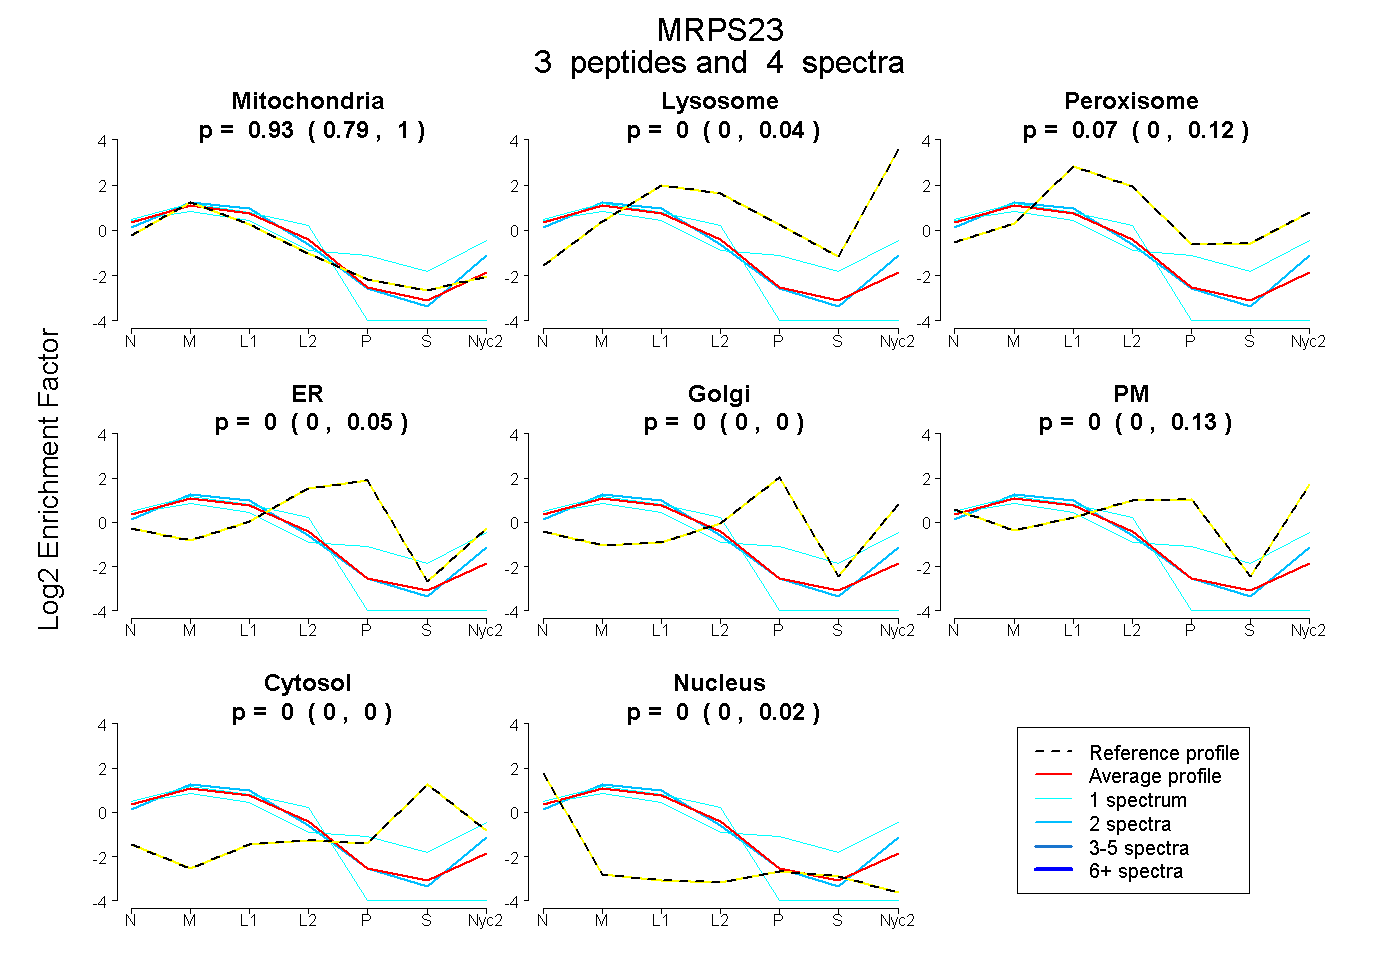
3 peptides |
4 spectra |
|
0.933 0.789 | 0.997 |
0.000 0.000 | 0.042 |
0.066 0.000 | 0.120 |
0.000 0.000 | 0.046 |
0.000 0.000 | 0.000 |
0.000 0.000 | 0.129 |
0.000 0.000 | 0.000 |
0.001 0.000 | 0.025 |
| 1 spectrum, LFVETGK | 0.610 | 0.024 | 0.034 | 0.000 | 0.000 | 0.271 | 0.059 | 0.000 | ||
| 1 spectrum, YTELQSLGETDEEK | 0.960 | 0.000 | 0.000 | 0.000 | 0.000 | 0.000 | 0.000 | 0.040 | ||
| 2 spectra, ALLAEGVILR | 0.901 | 0.087 | 0.012 | 0.000 | 0.000 | 0.000 | 0.000 | 0.000 |
| Plot | Mito | Lyso or Perox | ER | Golgi | PM | Cytosol | Nucleus | ||||||
| Expt B |
2 peptides |
2 spectra |
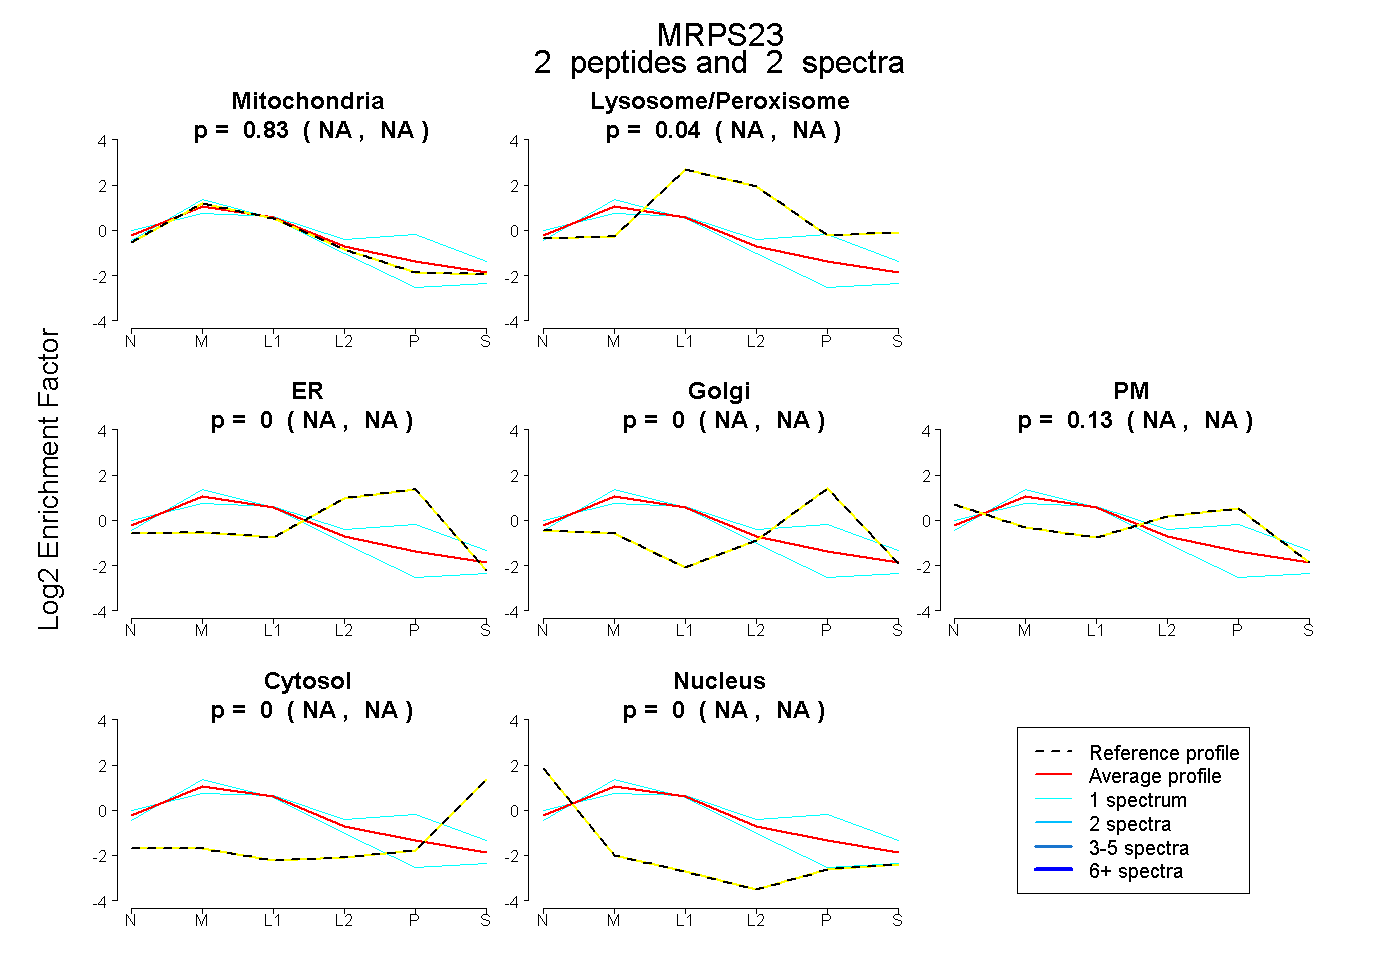 |
0.830 NA | NA |
0.040 NA | NA |
0.000 NA | NA |
0.000 NA | NA |
0.130 NA | NA |
0.000 NA | NA |
0.000 NA | NA |
|||
| Plot | Lyso | Other | |||||||||||
| Expt C |
7 peptides |
18 spectra |
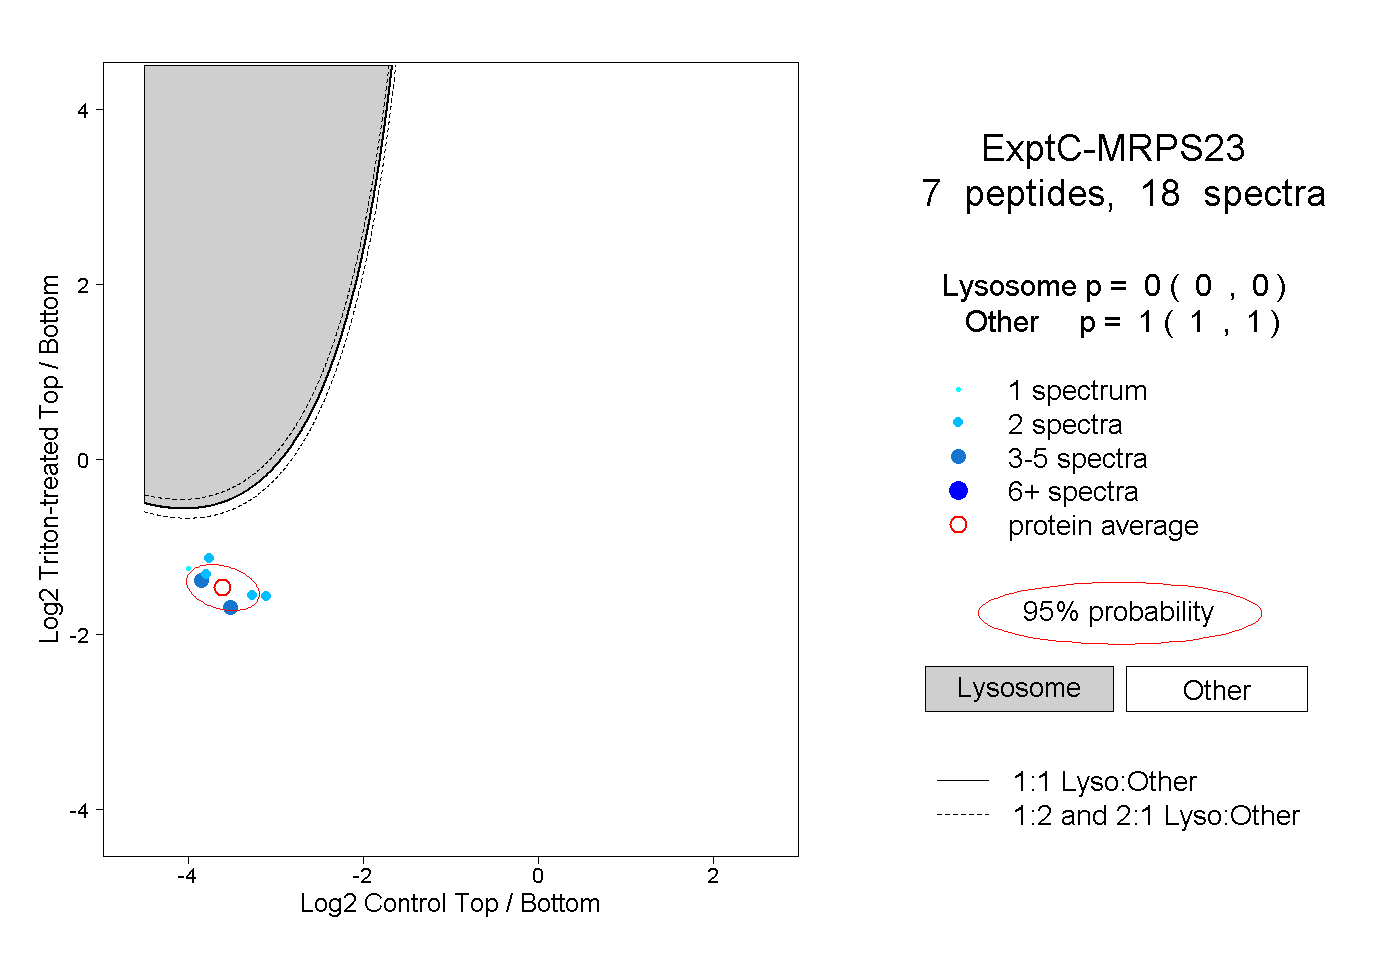 |
0.000 0.000 | 0.000 |
1.000 1.000 | 1.000 |