 5
5peptides
spectra
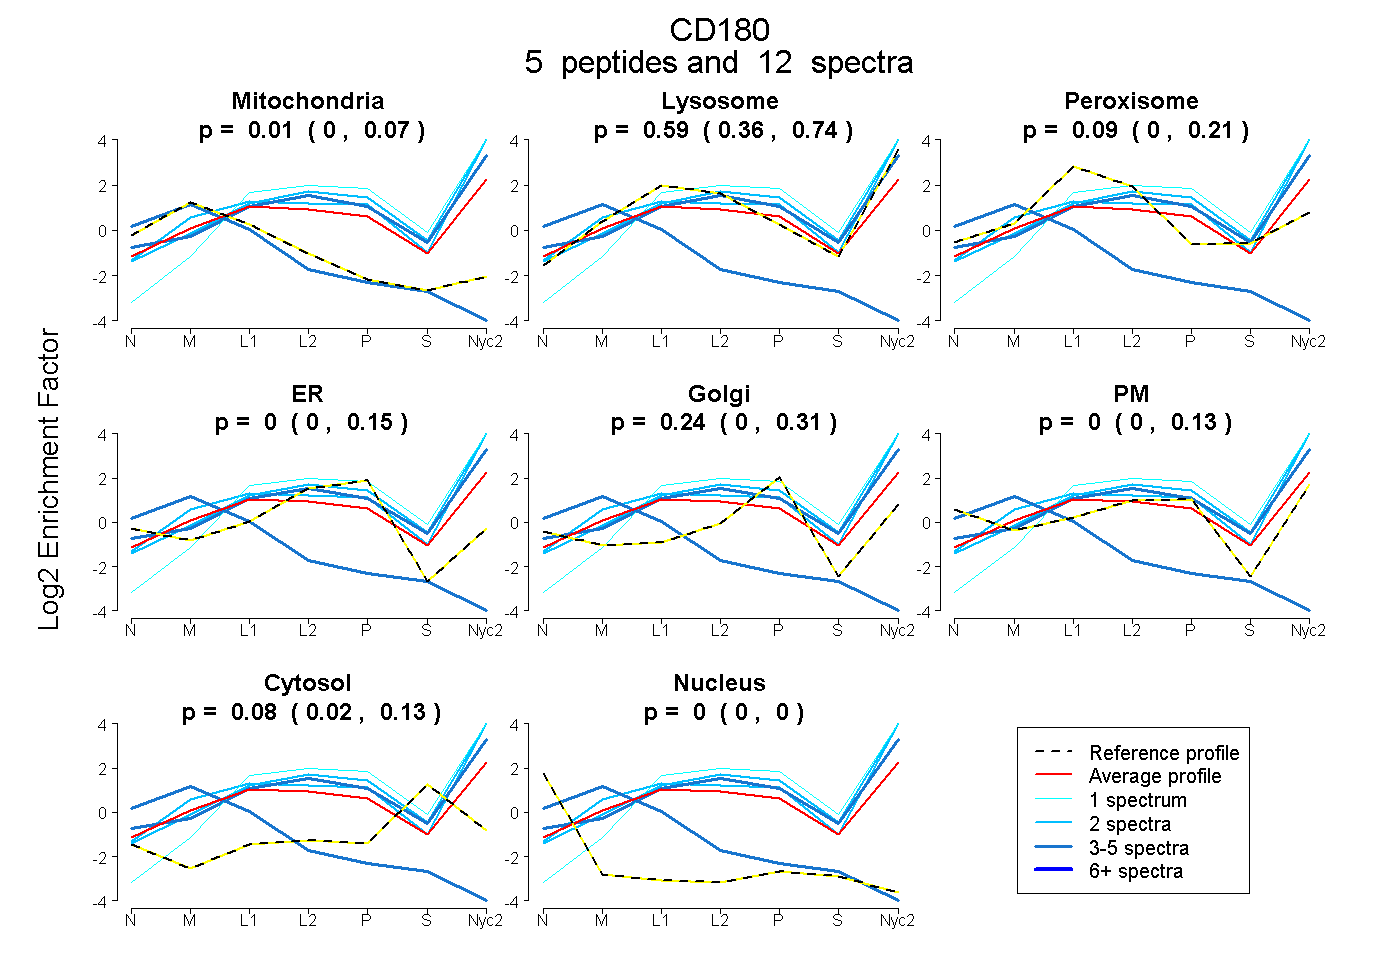
0.000 | 0.070
0.361 | 0.738
0.000 | 0.213
0.000 | 0.154
0.000 | 0.313
0.000 | 0.132
0.019 | 0.131
0.000 | 0.000
6peptides
spectra
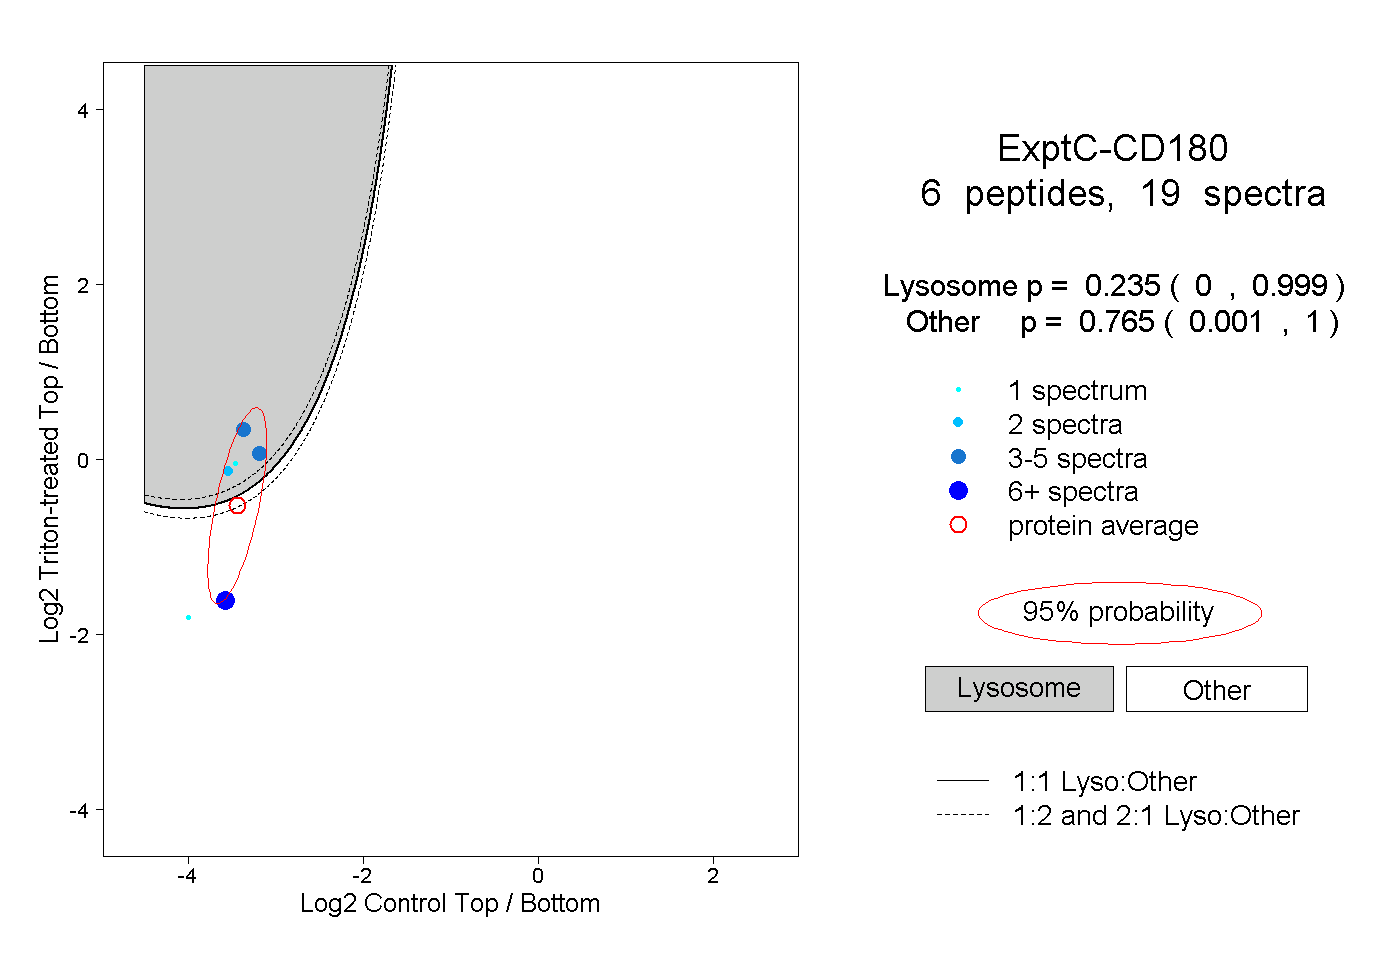
0.000 | 0.999
0.001 | 1.000
2peptides
spectra
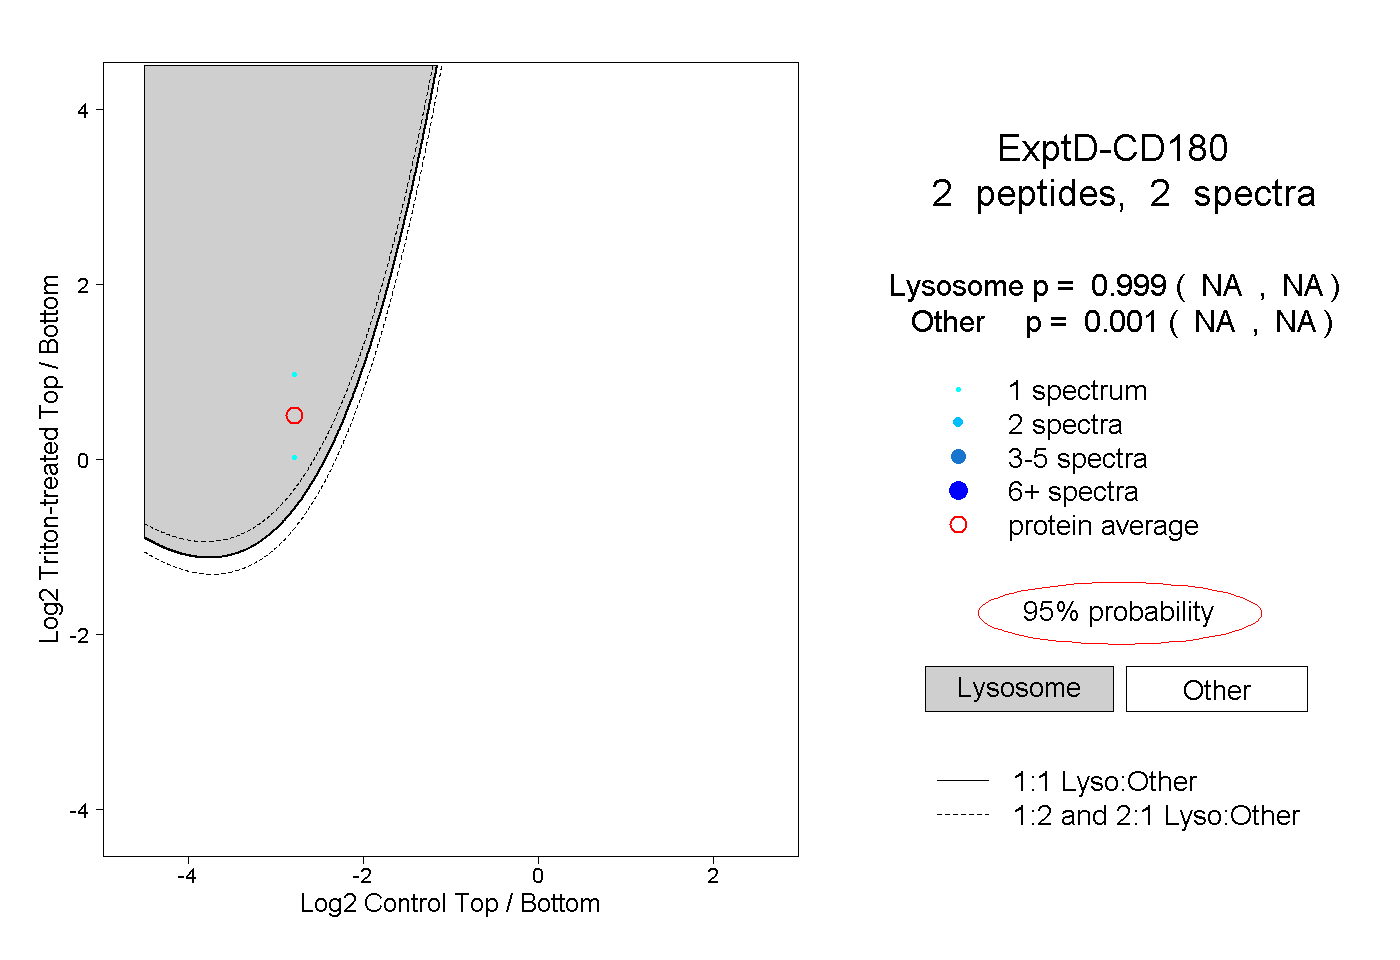
NA | NA
NA | NA