 5
5peptides
spectra
0.000 | 0.070
0.361 | 0.738
0.000 | 0.213
0.000 | 0.154
0.000 | 0.313
0.000 | 0.132
0.019 | 0.131
0.000 | 0.000
6peptides
spectra
0.000 | 0.999
0.001 | 1.000
| Plot | Mito | Lyso | Perox | ER | Golgi | PM | Cytosol | Nucleus | |||||
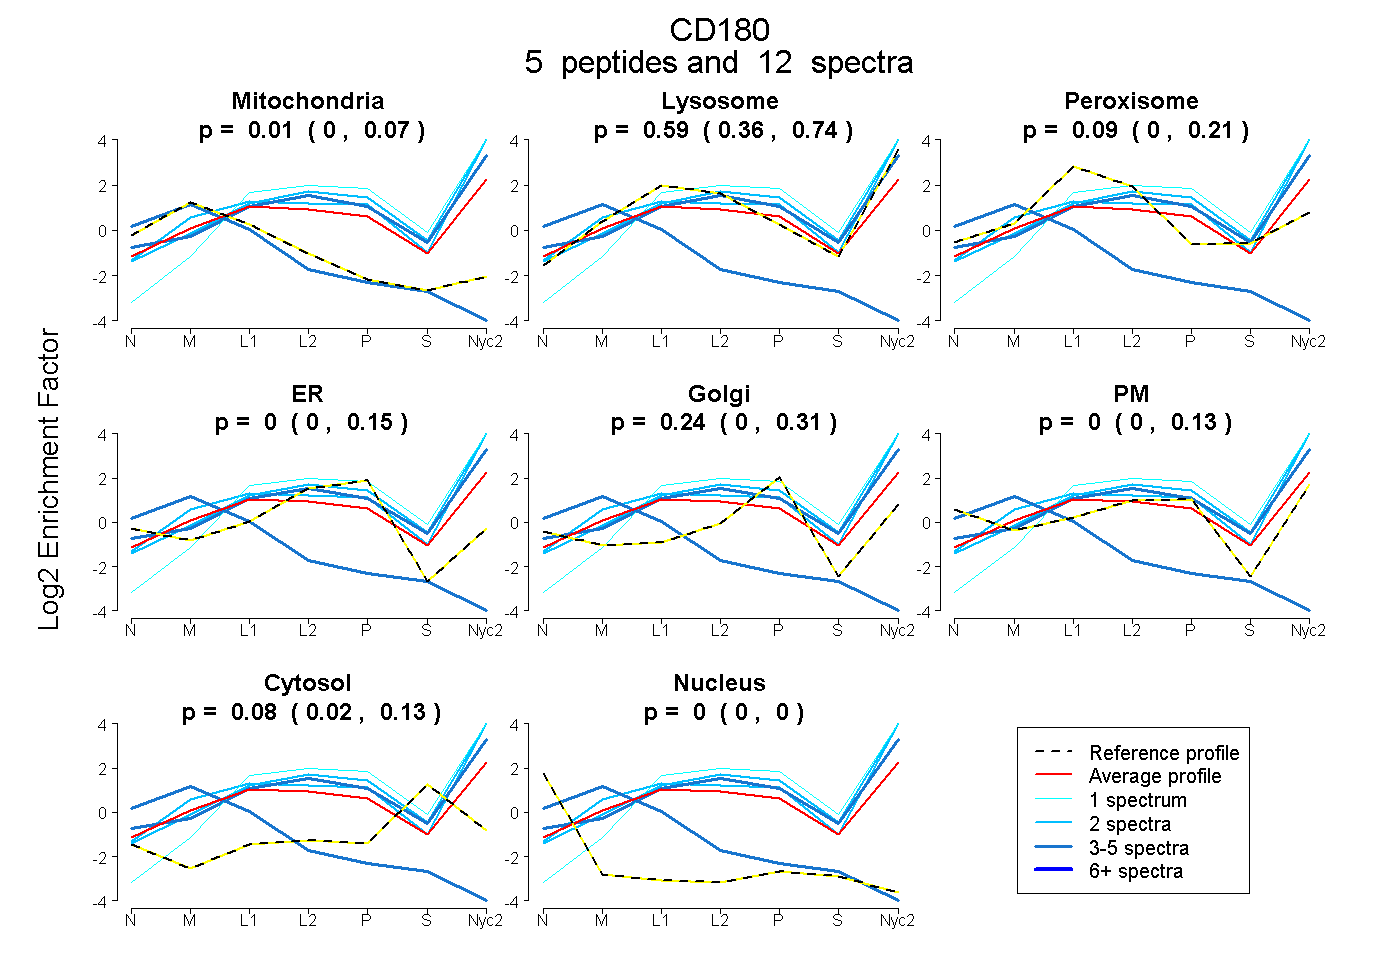
| Expt A |
5 peptides |
12 spectra |
|
0.008 0.000 | 0.070 |
0.590 0.361 | 0.738 |
0.085 0.000 | 0.213 |
0.000 0.000 | 0.154 |
0.239 0.000 | 0.313 |
0.000 0.000 | 0.132 |
0.079 0.019 | 0.131 |
0.000 0.000 | 0.000 |
||
| Plot | Lyso | Other | |||||||||||
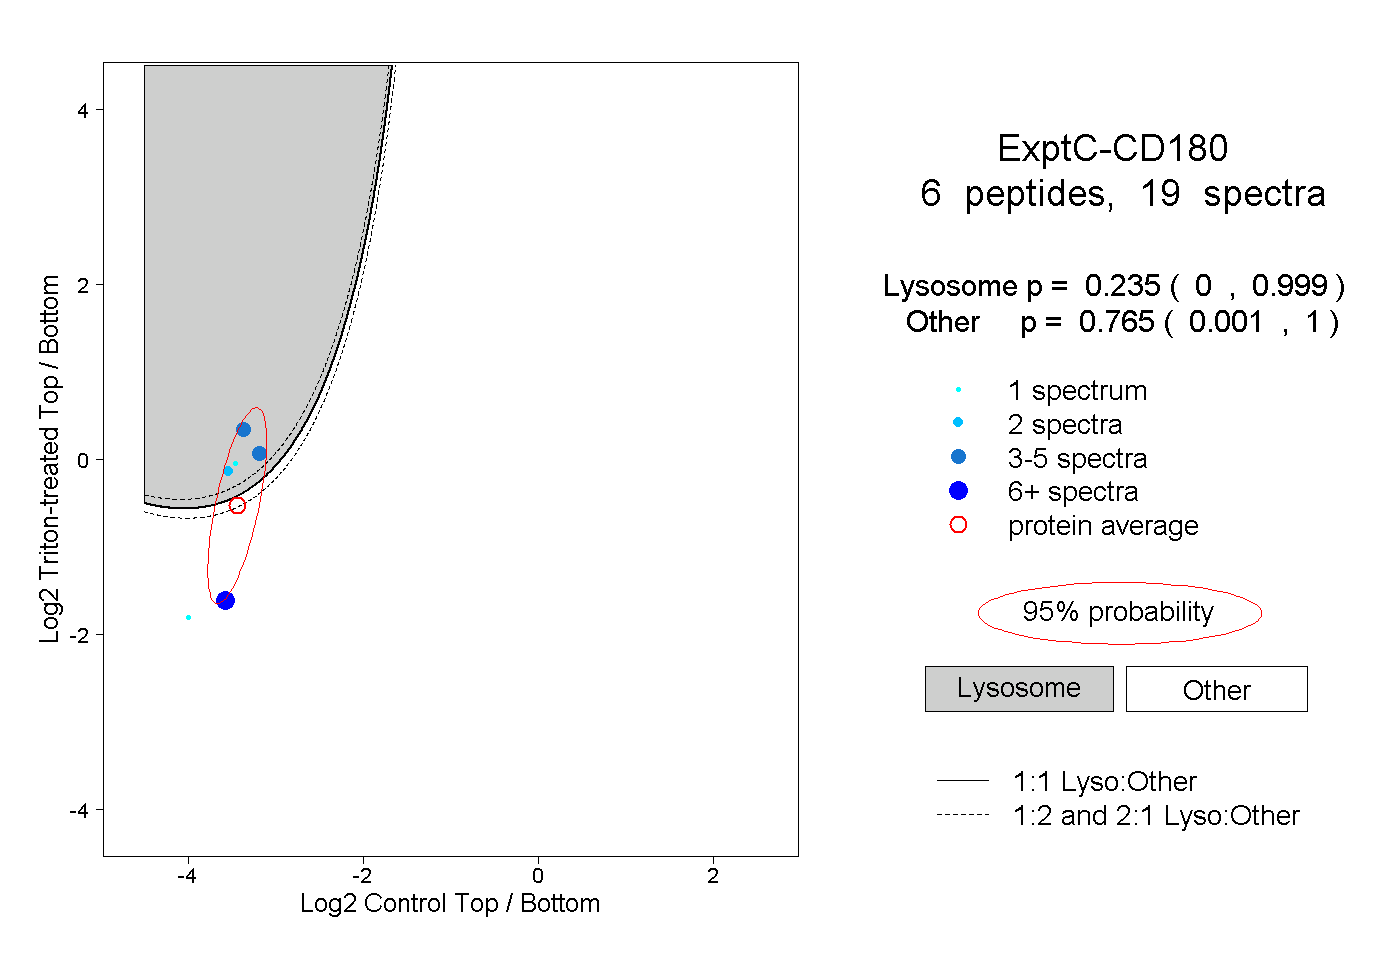
| Expt C |
6 peptides |
19 spectra |
|
0.235 0.000 | 0.999 |
0.765 0.001 | 1.000 |
| 1 spectrum, GIYLNLASNR | 0.985 | 0.015 | ||||||||
| 4 spectra, DFPTEK | 1.000 | 0.000 | ||||||||
| 6 spectra, LELGSGCLETLEHLR | 0.000 | 1.000 | ||||||||
| 1 spectrum, HLNLQGNR | 0.000 | 1.000 | ||||||||
| 2 spectra, DAQSPFQNLHLLK | 0.976 | 0.024 | ||||||||
| 5 spectra, LVLSANK | 0.962 | 0.038 |
| Plot | Lyso | Other | |||||||||||
| Expt D |
2 peptides |
2 spectra |
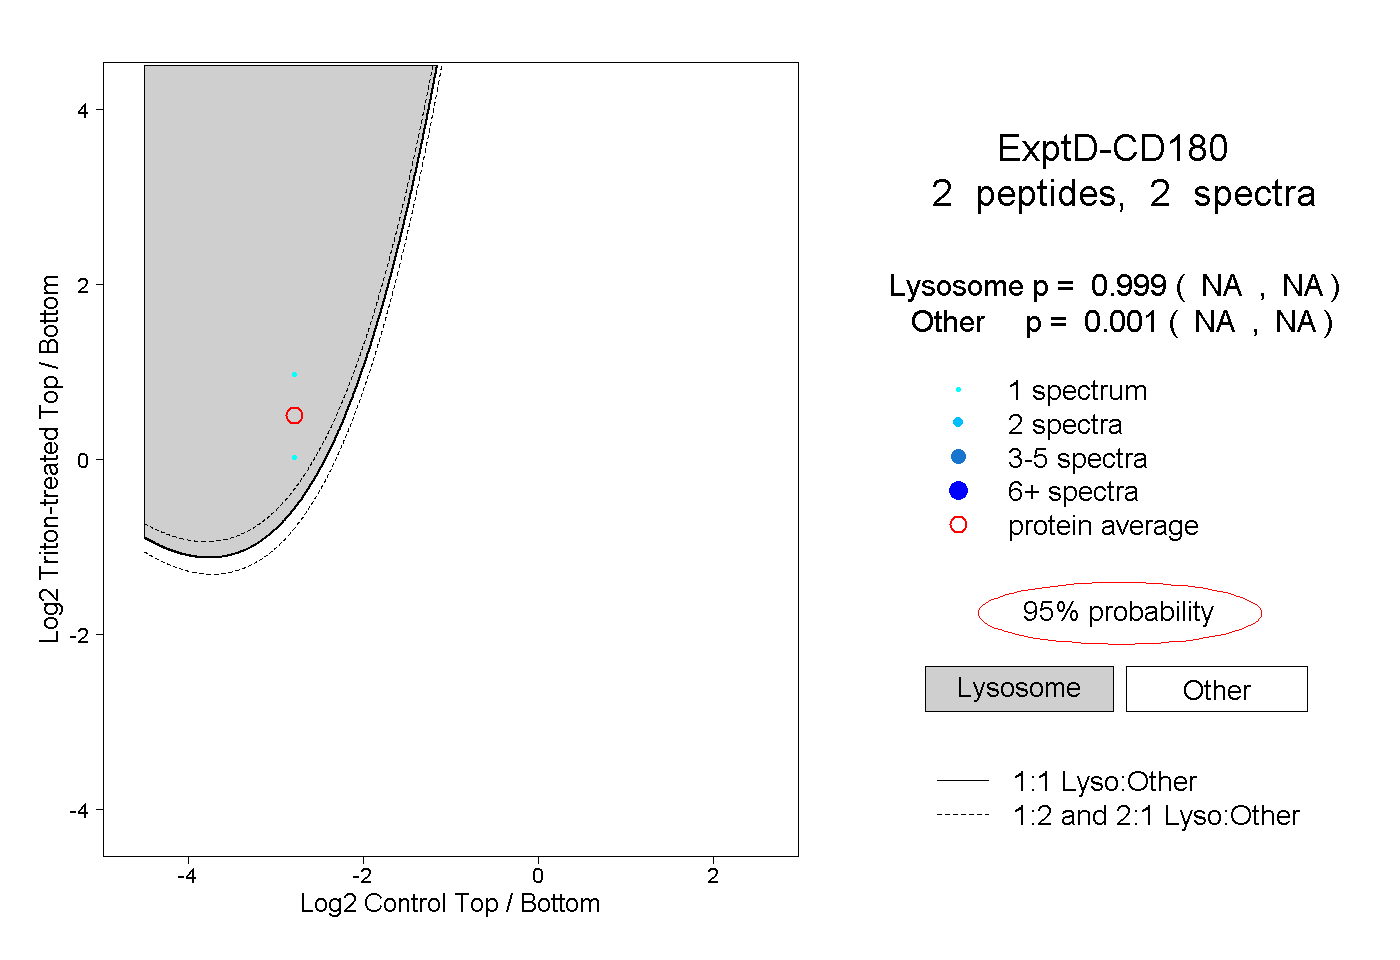 |
0.999 NA | NA |
0.001 NA | NA |