 7
7peptides
spectra
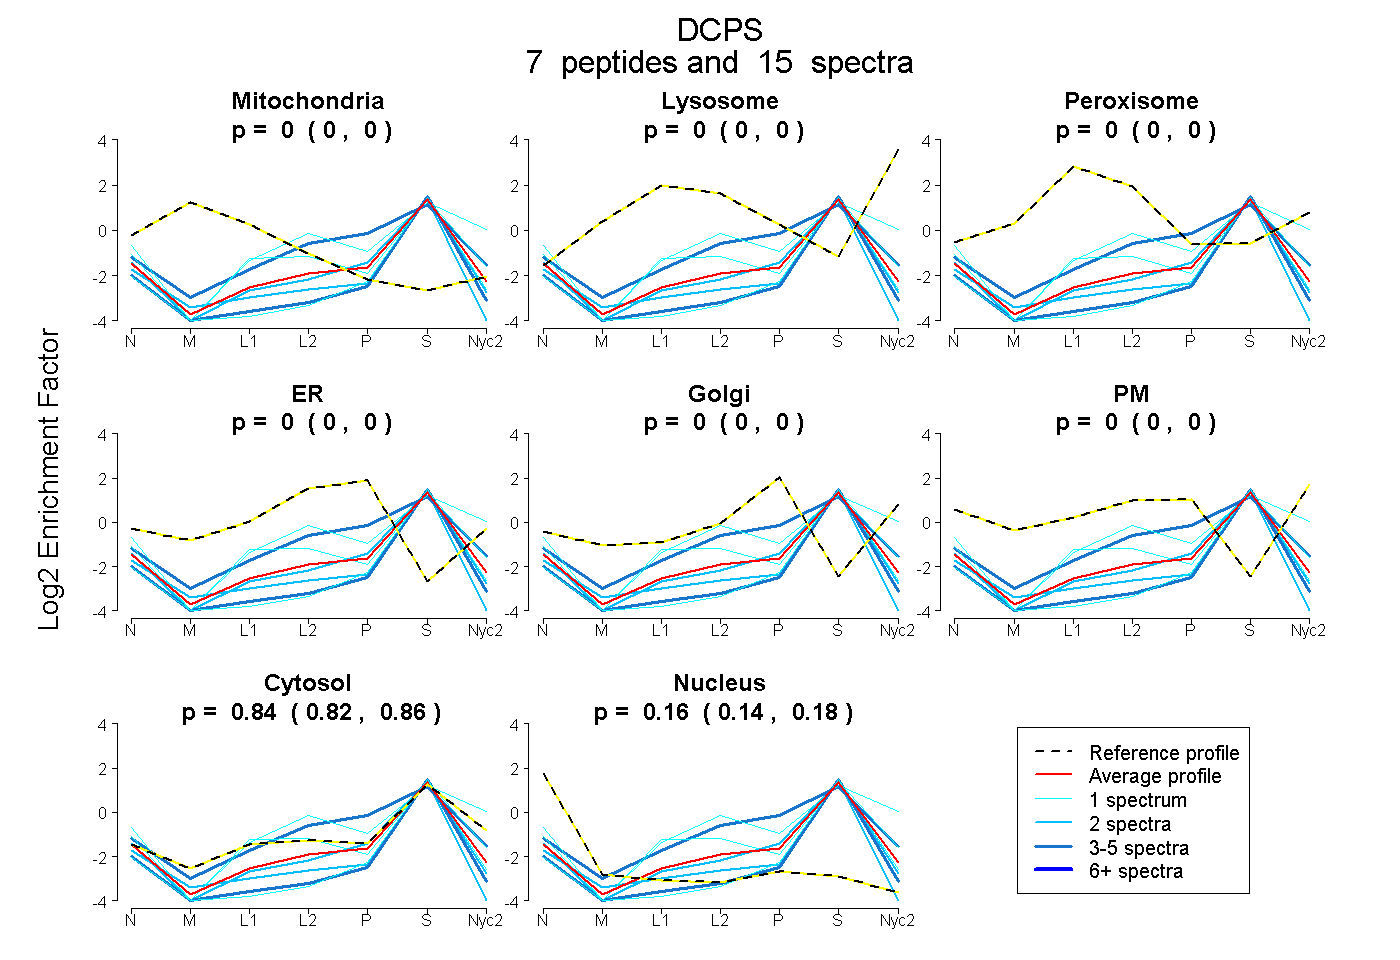
0.000 | 0.000
0.000 | 0.000
0.000 | 0.000
0.000 | 0.000
0.000 | 0.000
0.000 | 0.000
0.815 | 0.856
0.141 | 0.181
3peptides
spectra
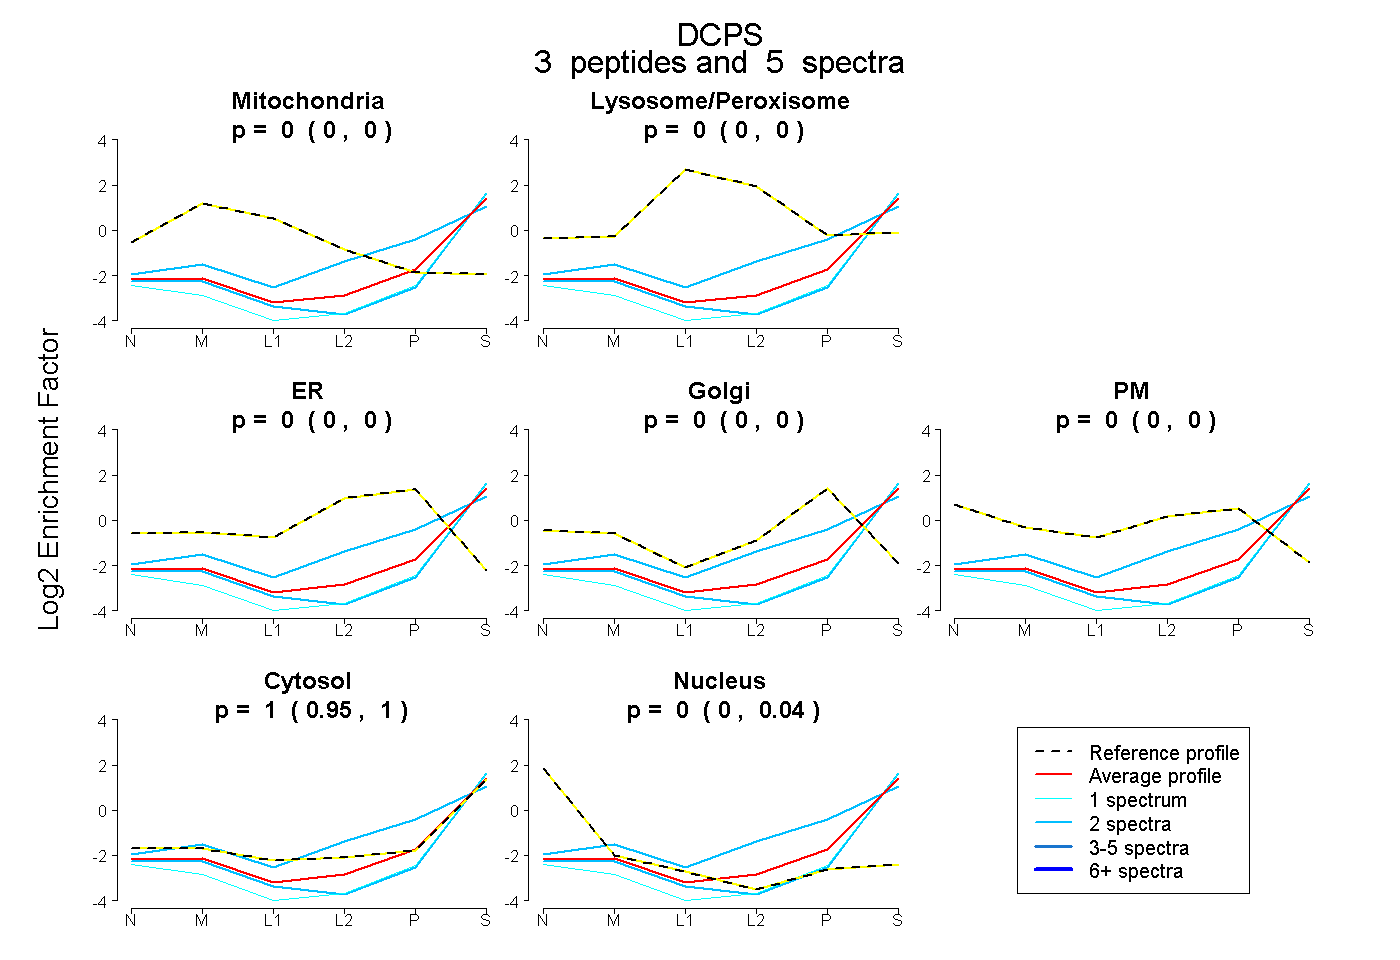
0.000 | 0.000
0.000 | 0.000
0.000 | 0.000
0.000 | 0.000
0.000 | 0.000
0.955 | 1.000
0.000 | 0.036
2peptides
spectra
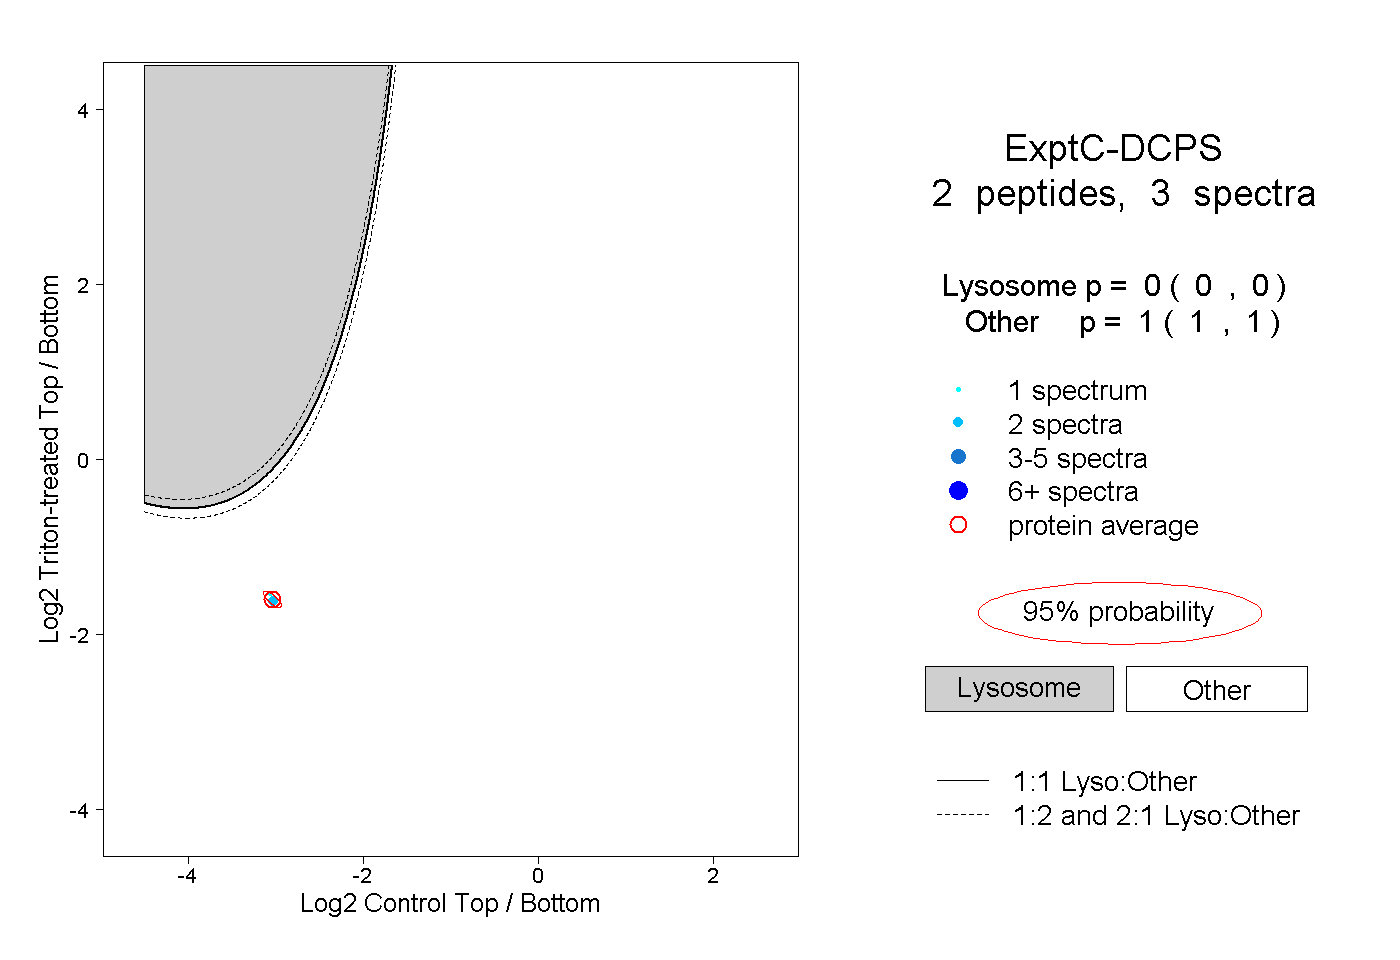
0.000 | 0.000
1.000 | 1.000