DCPS
[ENSRNOP00000013763]
Main page
| | | Plot |
Mito |
Lyso |
|
Perox |
ER |
Golgi |
PM |
Cytosol |
Nucleus |
|
| Expt A |
 7
7
peptides |
15
spectra |
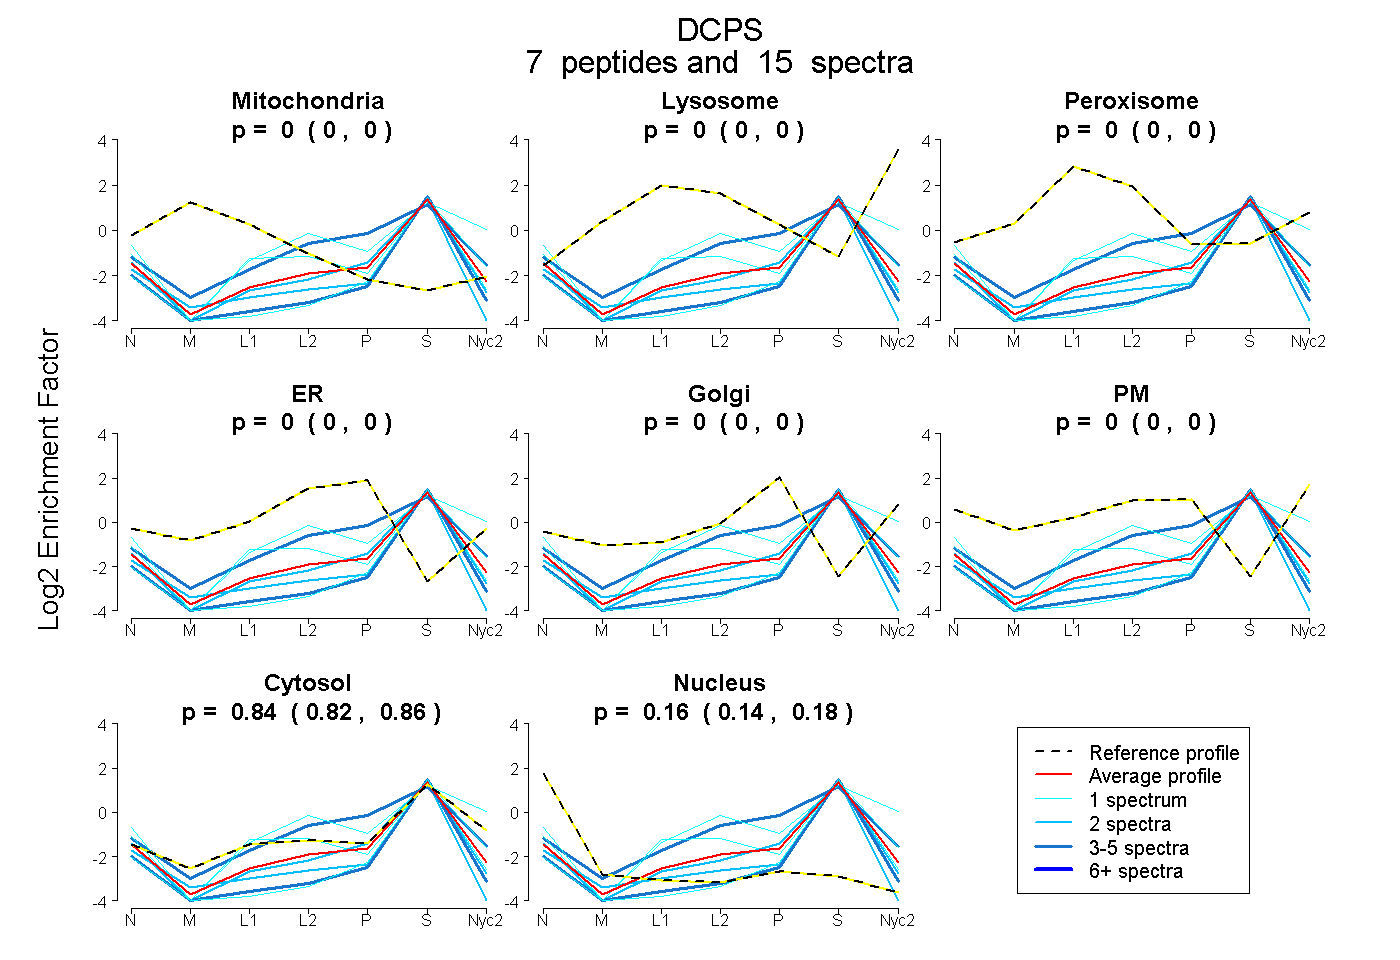 |
0.000
0.000 | 0.000 |
0.000
0.000 | 0.000 |
|
0.000
0.000 | 0.000 |
0.000
0.000 | 0.000 |
0.000
0.000 | 0.000 |
0.000
0.000 | 0.000 |
0.838
0.815 | 0.856 |
0.162
0.141 | 0.181 |
|
| | | Plot |
Mito |
|
Lyso or Perox |
|
ER |
Golgi |
PM |
Cytosol |
Nucleus |
|
| Expt B |
3
peptides |
5
spectra |
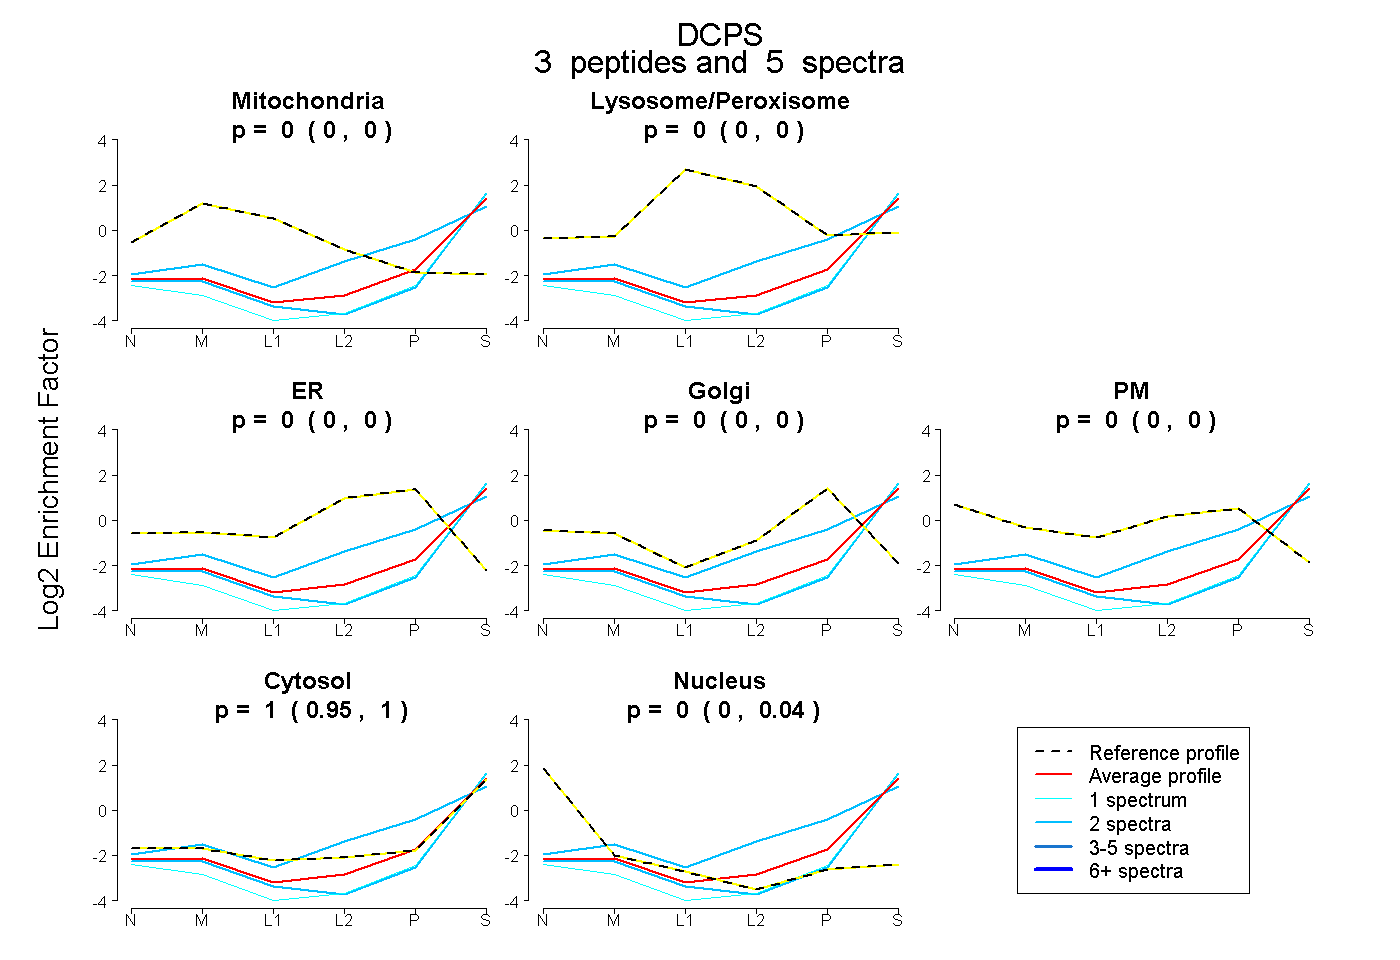 |
0.000
0.000 | 0.000 |
|
0.000
0.000 | 0.000 |
|
0.000
0.000 | 0.000 |
0.000
0.000 | 0.000 |
0.000
0.000 | 0.000 |
1.000
0.955 | 1.000 |
0.000
0.000 | 0.036 |
|
| 2 spectra, TLTFALR |
0.000 |
|
0.000 |
|
0.040 |
0.196 |
0.000 |
0.764 |
0.000 |
|
| 1 spectrum, TDDPLLQLLQK |
0.000 |
|
0.000 |
|
0.000 |
0.000 |
0.000 |
0.985 |
0.015 |
|
| 2 spectra, LPFSGFR |
0.000 |
|
0.000 |
|
0.000 |
0.000 |
0.000 |
0.973 |
0.027 |
|
| | | Plot |
|
Lyso |
|
|
|
|
|
|
|
Other |
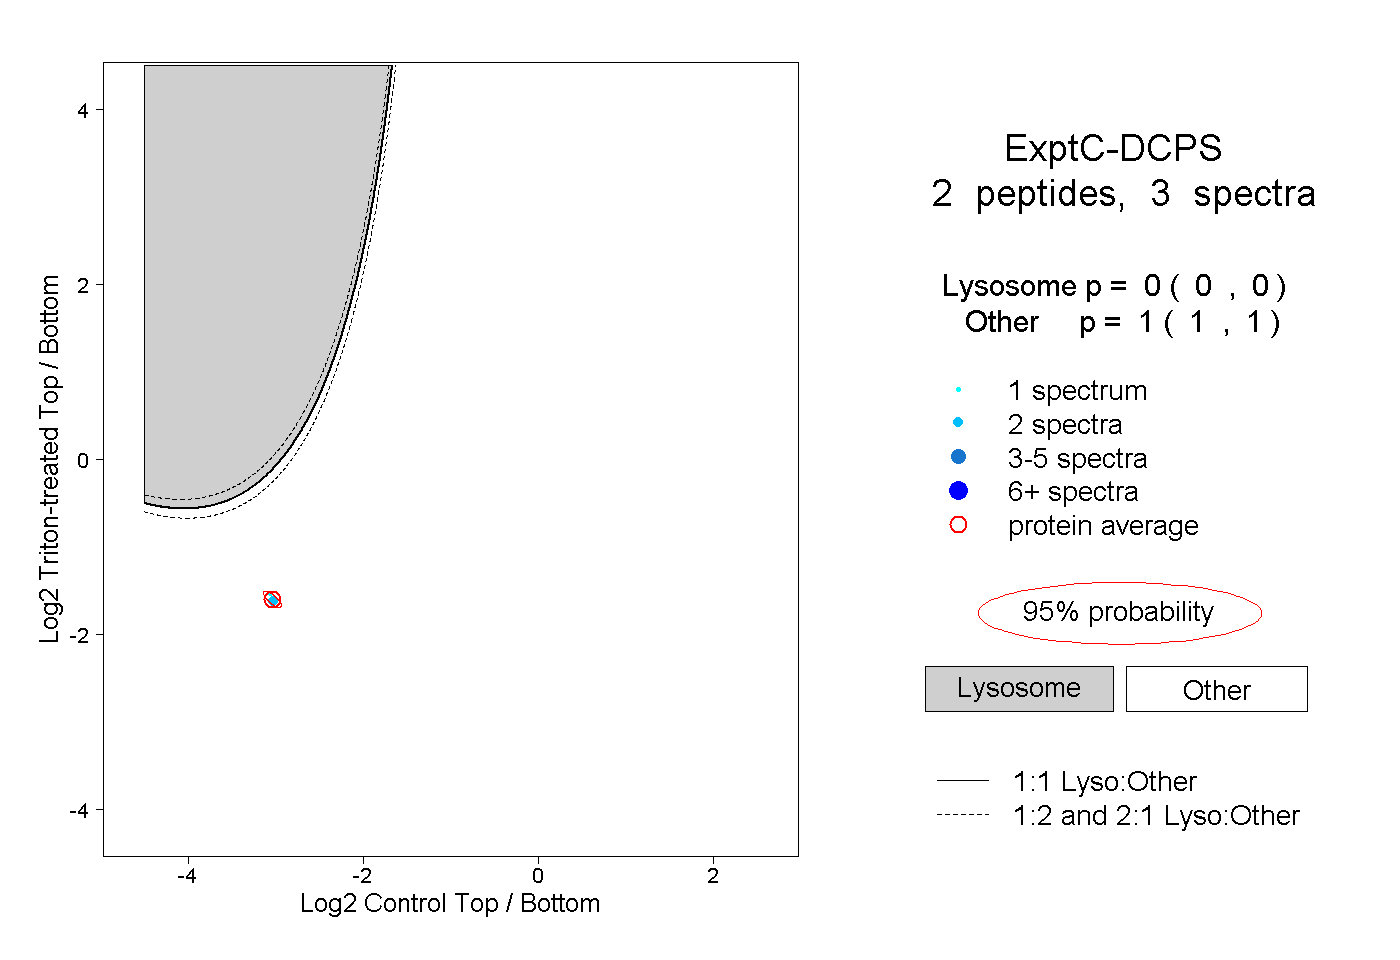
| Expt C |
2
peptides |
3
spectra |
 |
|
0.000
0.000 | 0.000 |
|
|
|
|
|
|
|
1.000
1.000 | 1.000 |