 8
8peptides
spectra
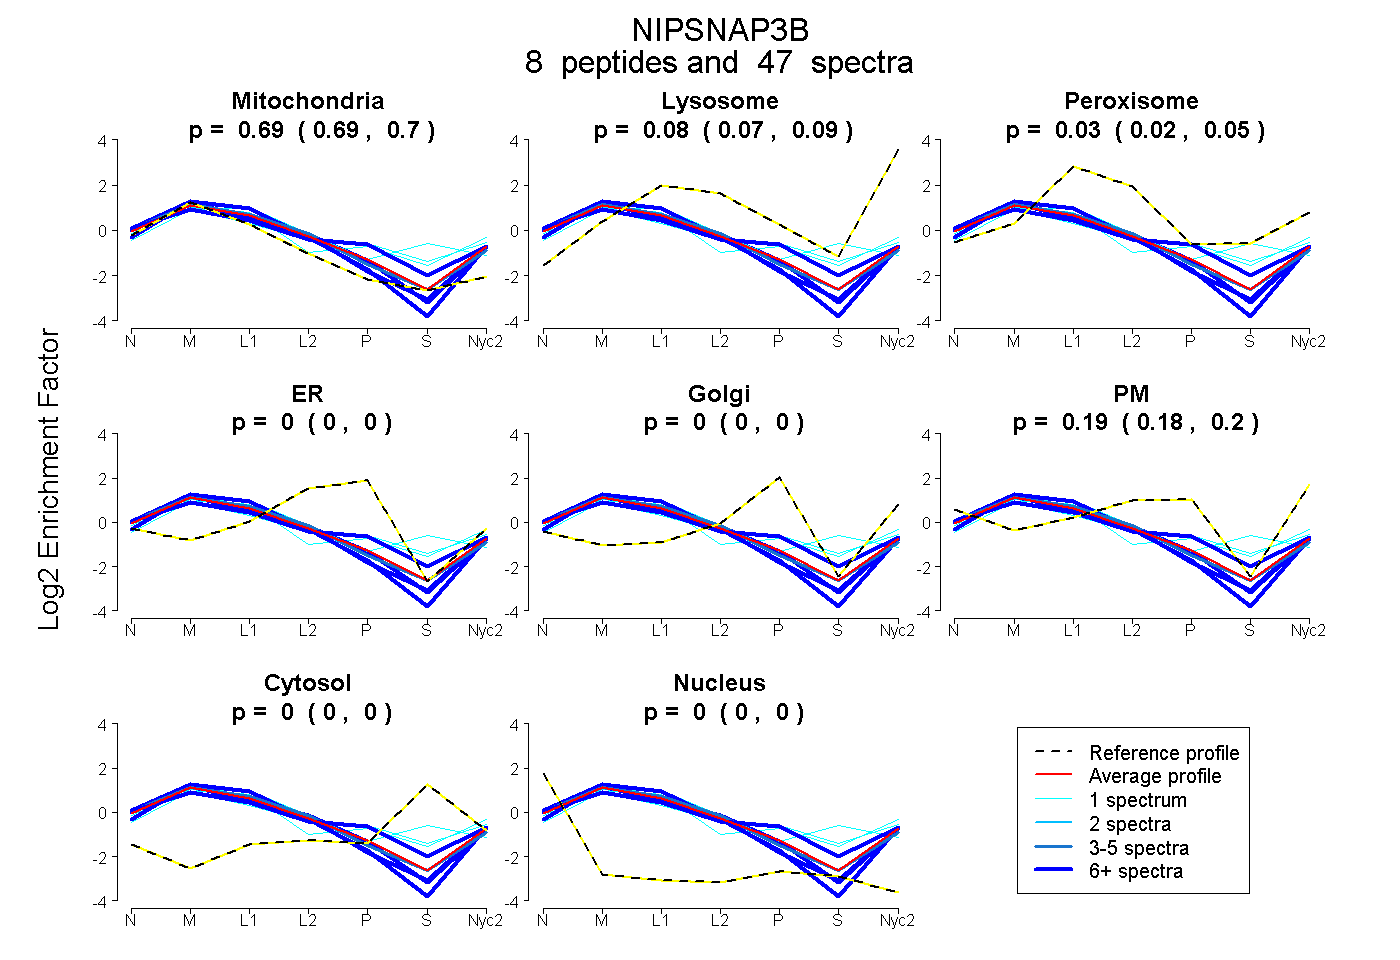
0.686 | 0.701
0.073 | 0.088
0.018 | 0.048
0.000 | 0.000
0.000 | 0.000
0.178 | 0.202
0.000 | 0.000
0.000 | 0.000
6peptides
spectra
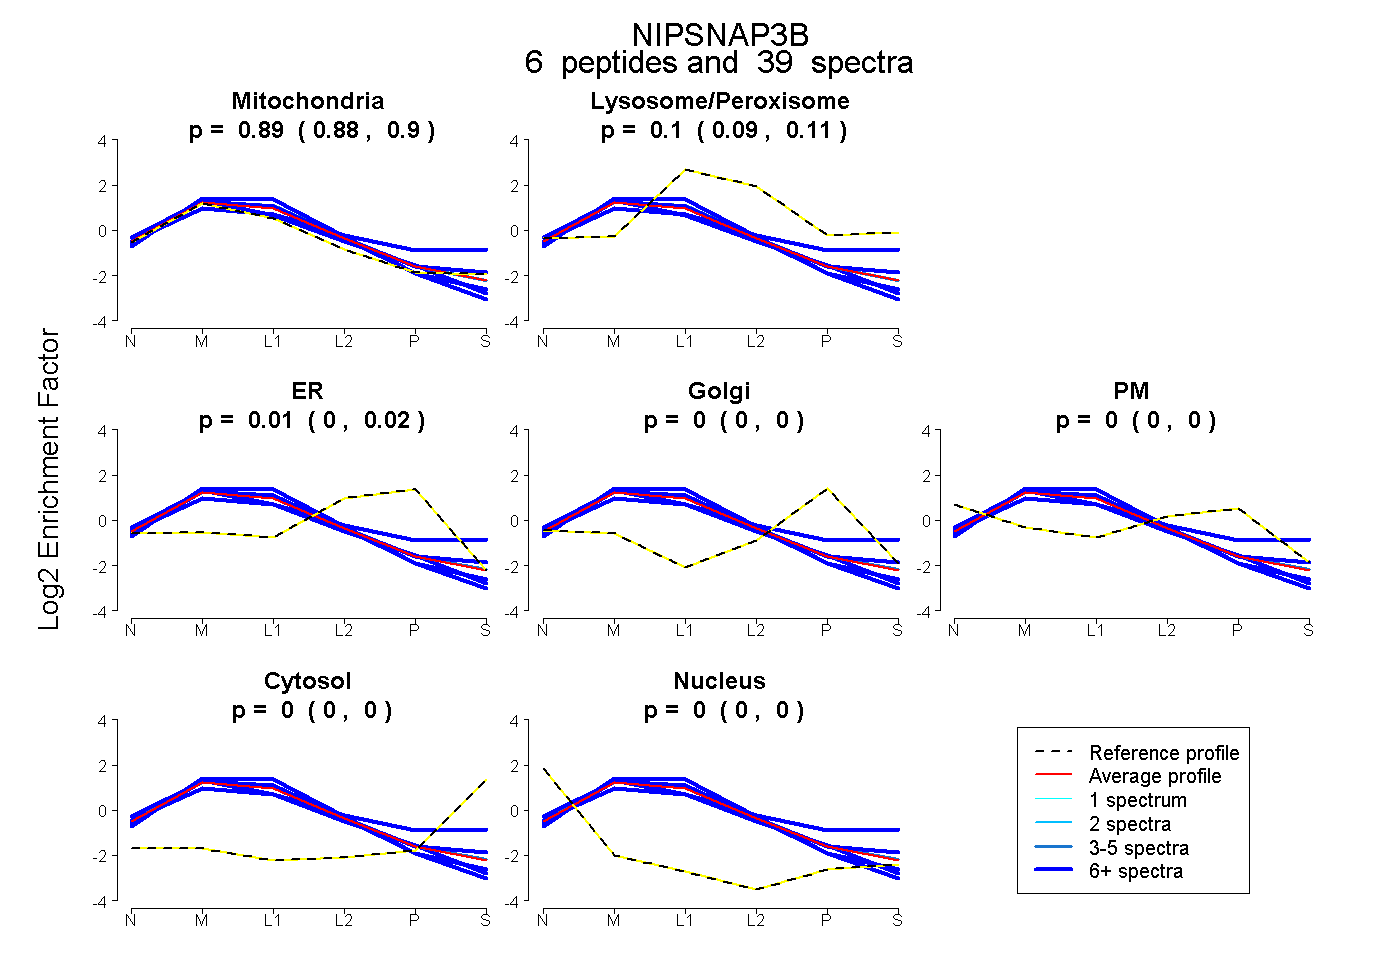
0.877 | 0.895
0.086 | 0.112
0.001 | 0.024
0.000 | 0.000
0.000 | 0.000
0.000 | 0.000
0.000 | 0.000
8peptides
spectra
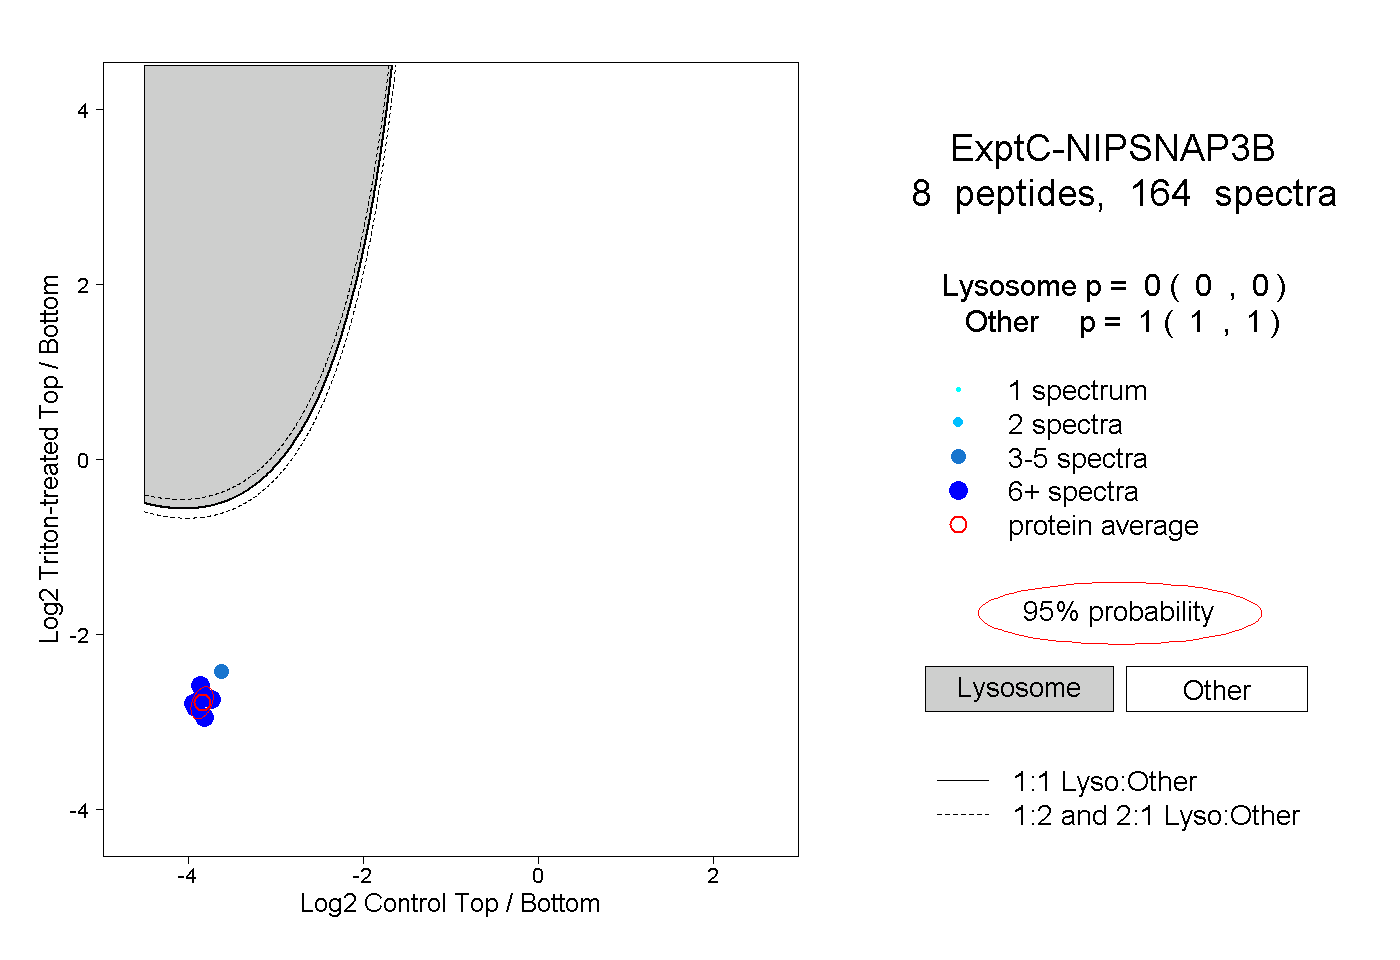
0.000 | 0.000
1.000 | 1.000
5peptides
spectra
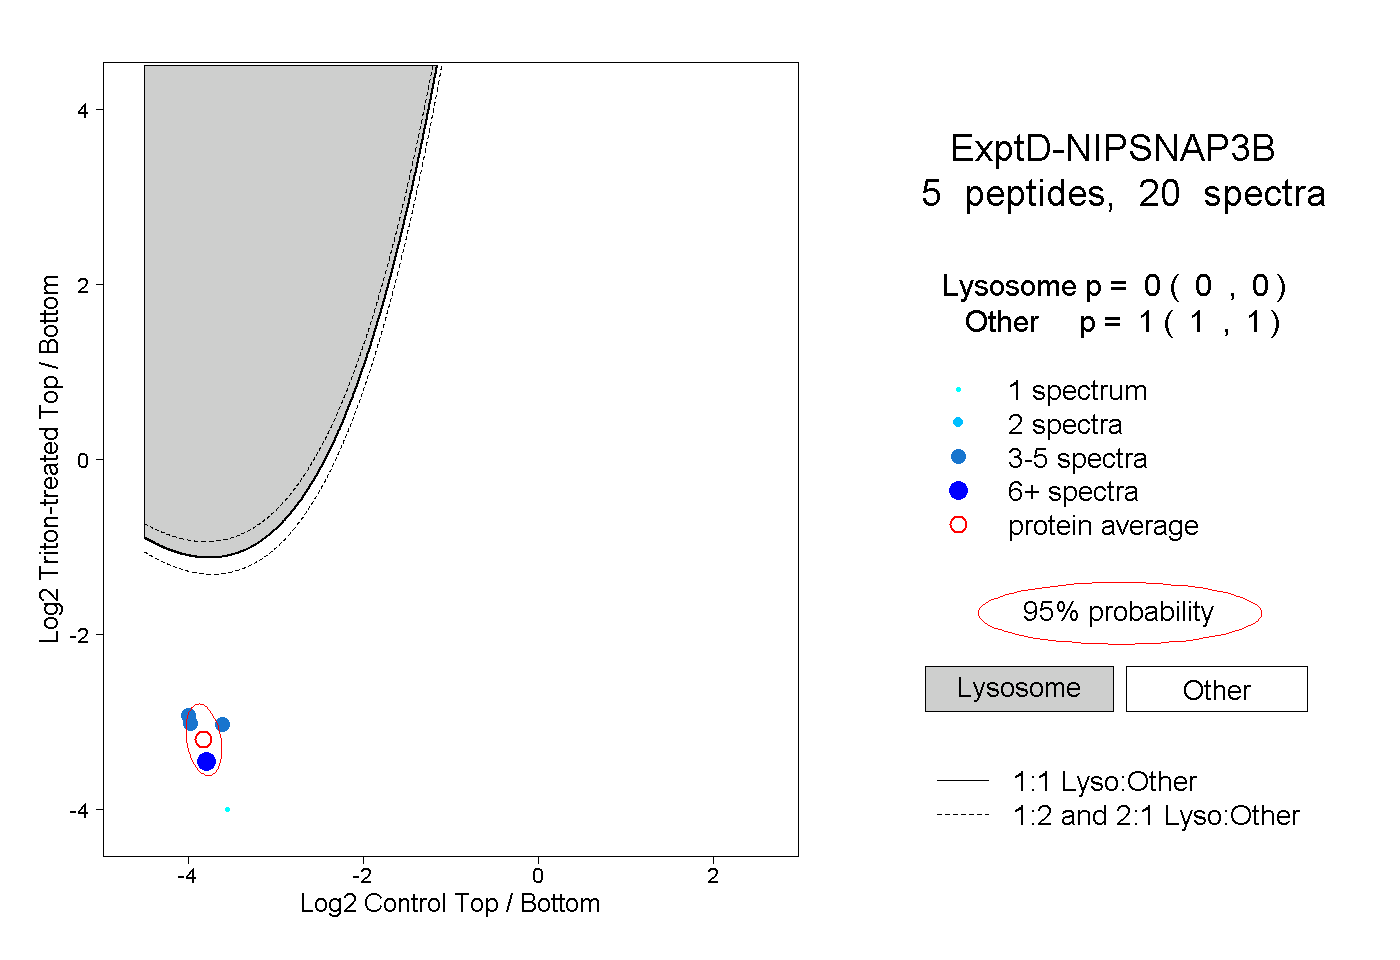
0.000 | 0.000
1.000 | 1.000