 8
8peptides
spectra
0.686 | 0.701
0.073 | 0.088
0.018 | 0.048
0.000 | 0.000
0.000 | 0.000
0.178 | 0.202
0.000 | 0.000
0.000 | 0.000
| Plot | Mito | Lyso | Perox | ER | Golgi | PM | Cytosol | Nucleus | |||||
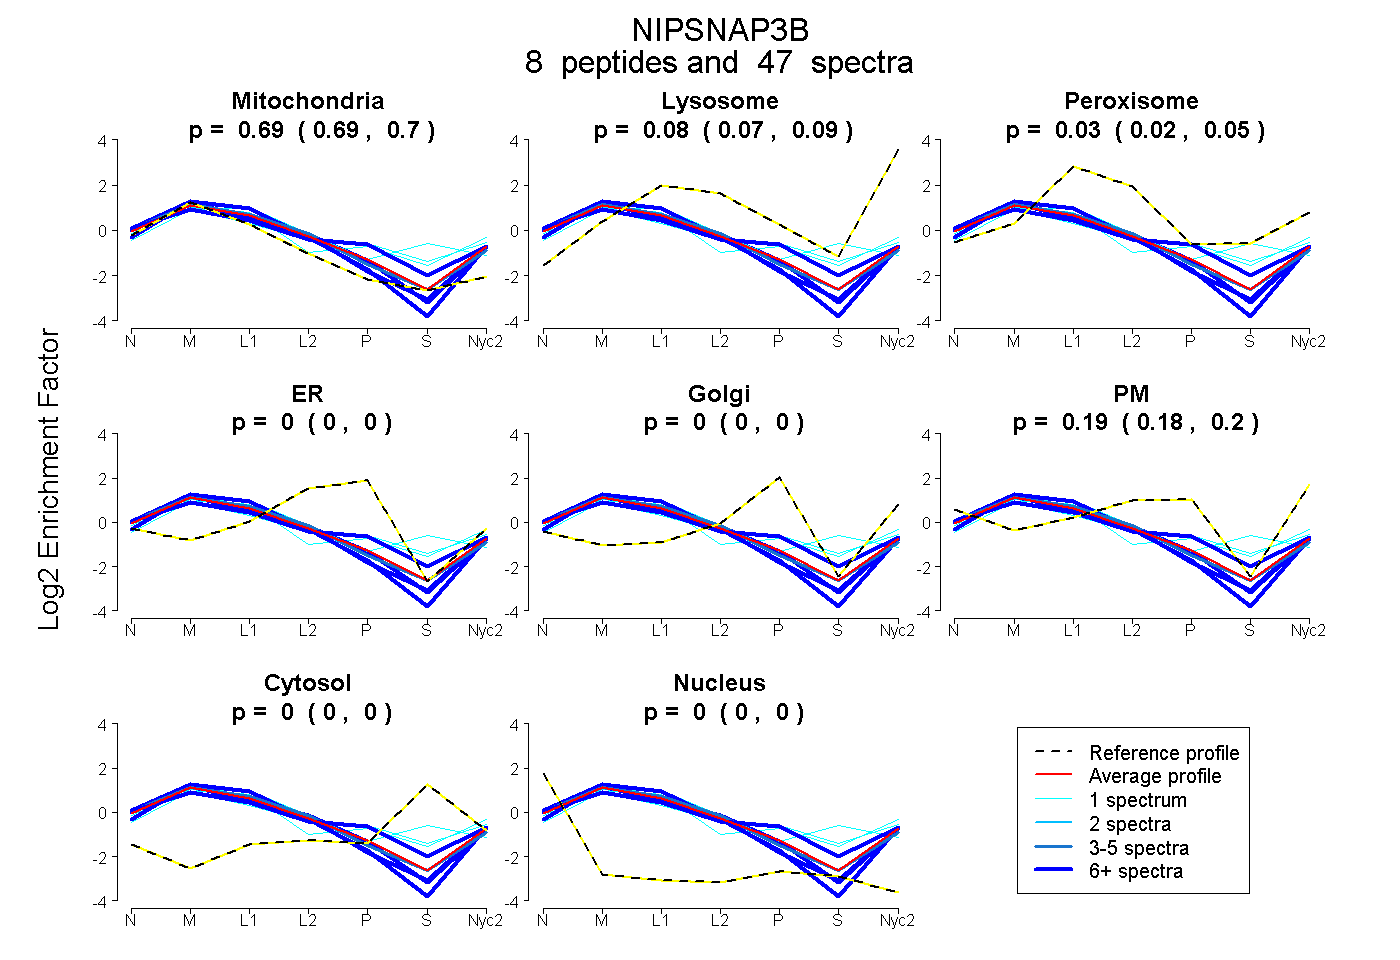
| Expt A |
8 peptides |
47 spectra |
|
0.694 0.686 | 0.701 |
0.081 0.073 | 0.088 |
0.034 0.018 | 0.048 |
0.000 0.000 | 0.000 |
0.000 0.000 | 0.000 |
0.191 0.178 | 0.202 |
0.000 0.000 | 0.000 |
0.000 0.000 | 0.000 |
| 11 spectra, YDNFAHR | 0.574 | 0.000 | 0.131 | 0.000 | 0.141 | 0.155 | 0.000 | 0.000 | ||
| 8 spectra, VFHIWK | 0.761 | 0.065 | 0.000 | 0.000 | 0.000 | 0.174 | 0.000 | 0.000 | ||
| 8 spectra, TNAFLQNFQK | 0.774 | 0.145 | 0.000 | 0.000 | 0.000 | 0.081 | 0.000 | 0.000 | ||
| 5 spectra, VVAAVR | 0.696 | 0.015 | 0.121 | 0.000 | 0.000 | 0.167 | 0.000 | 0.000 | ||
| 1 spectrum, HWSHEDPR | 0.593 | 0.183 | 0.061 | 0.000 | 0.117 | 0.002 | 0.044 | 0.000 | ||
| 12 spectra, QSDGTLYEFR | 0.703 | 0.049 | 0.000 | 0.000 | 0.000 | 0.249 | 0.000 | 0.000 | ||
| 1 spectrum, VHVLWWNDSADSR | 0.491 | 0.007 | 0.161 | 0.000 | 0.095 | 0.164 | 0.082 | 0.000 | ||
| 1 spectrum, TAHSEMIGYWTVEFGGK | 0.481 | 0.000 | 0.366 | 0.000 | 0.000 | 0.000 | 0.153 | 0.000 |
| Plot | Mito | Lyso or Perox | ER | Golgi | PM | Cytosol | Nucleus | ||||||
| Expt B |
6 peptides |
39 spectra |
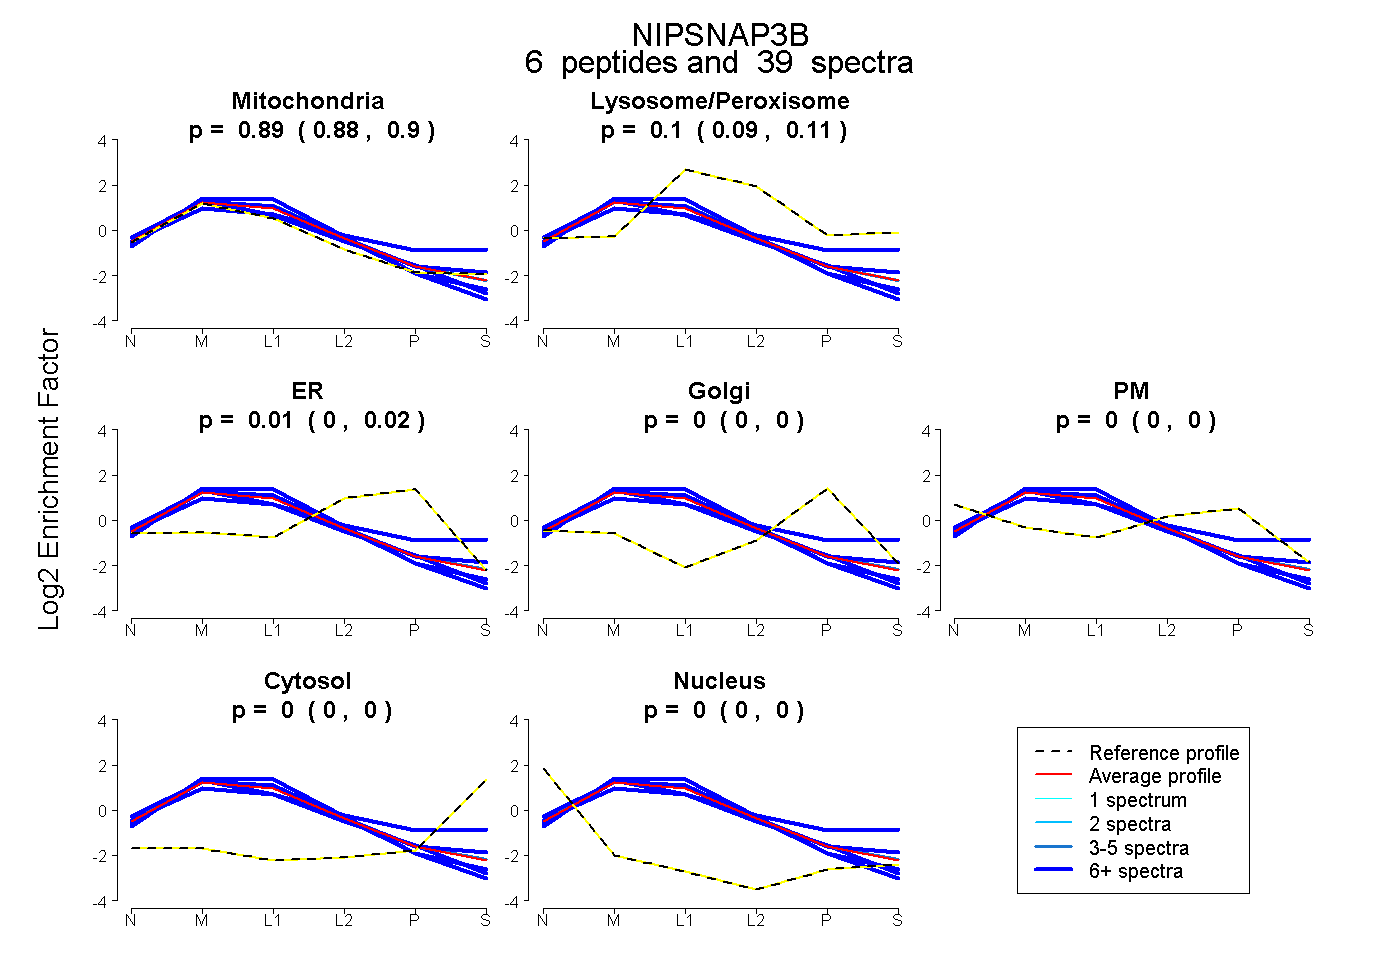 |
0.887 0.877 | 0.895 |
0.099 0.086 | 0.112 |
0.014 0.001 | 0.024 |
0.000 0.000 | 0.000 |
0.000 0.000 | 0.000 |
0.000 0.000 | 0.000 |
0.000 0.000 | 0.000 |
|||
| Plot | Lyso | Other | |||||||||||
| Expt C |
8 peptides |
164 spectra |
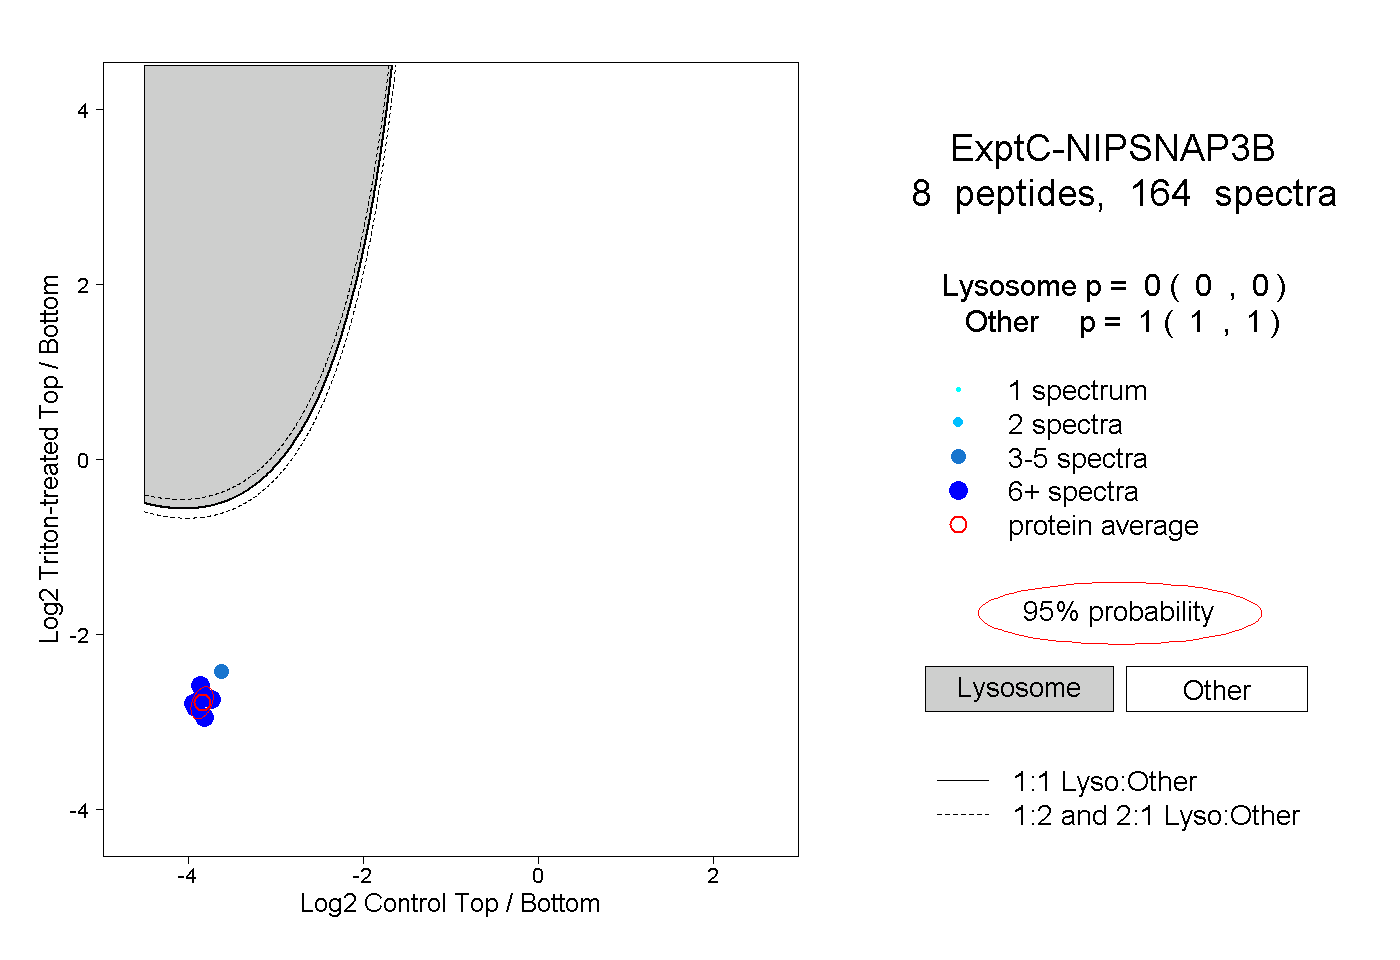 |
0.000 0.000 | 0.000 |
1.000 1.000 | 1.000 |
||||||||
| Plot | Lyso | Other | |||||||||||
| Expt D |
5 peptides |
20 spectra |
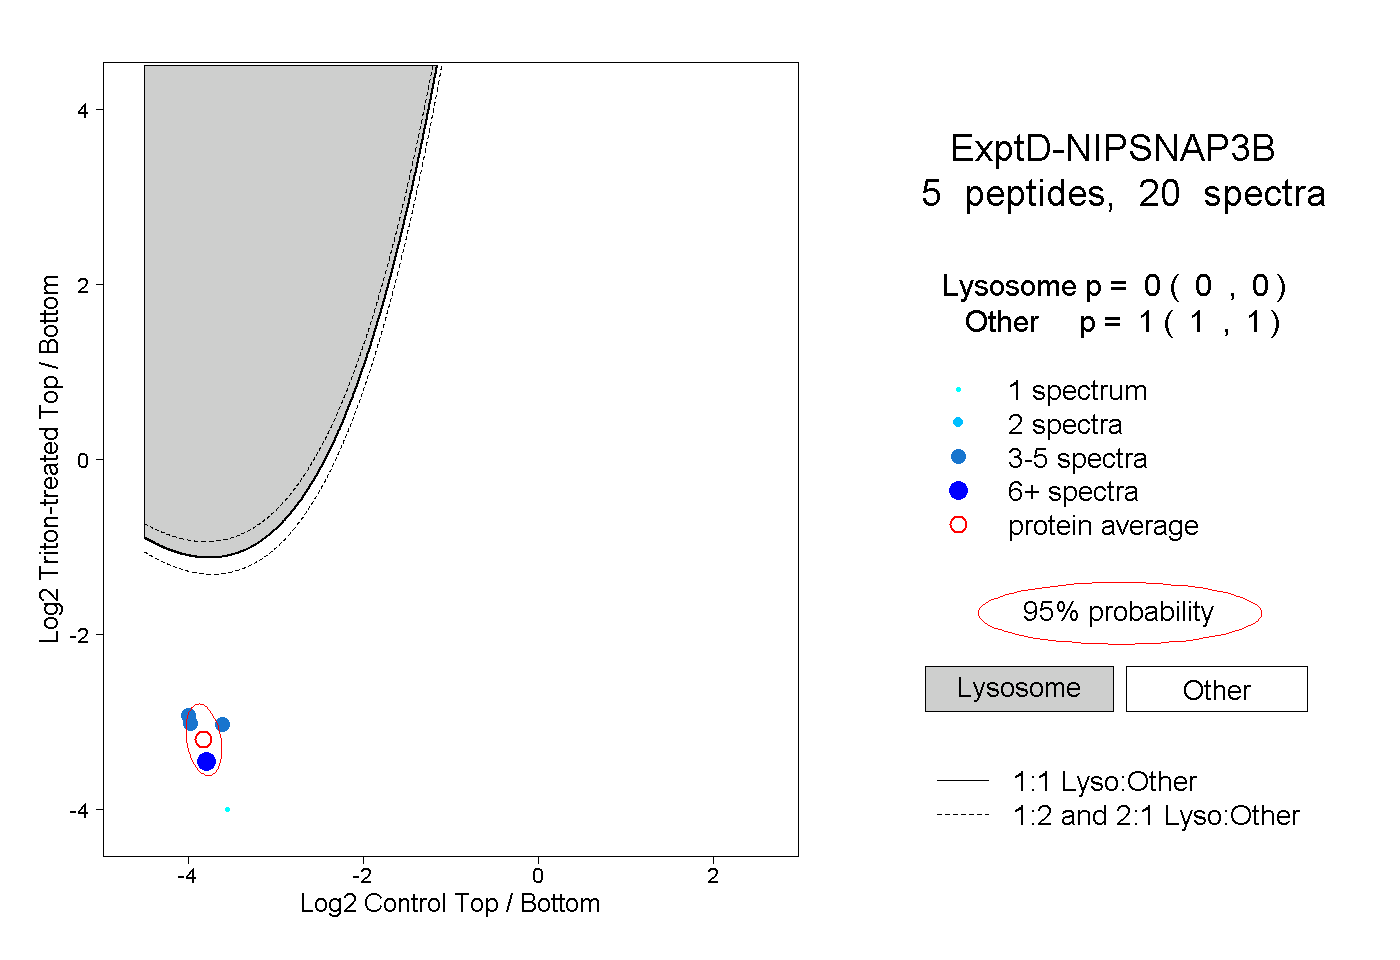 |
0.000 0.000 | 0.000 |
1.000 1.000 | 1.000 |