 27
27peptides
spectra
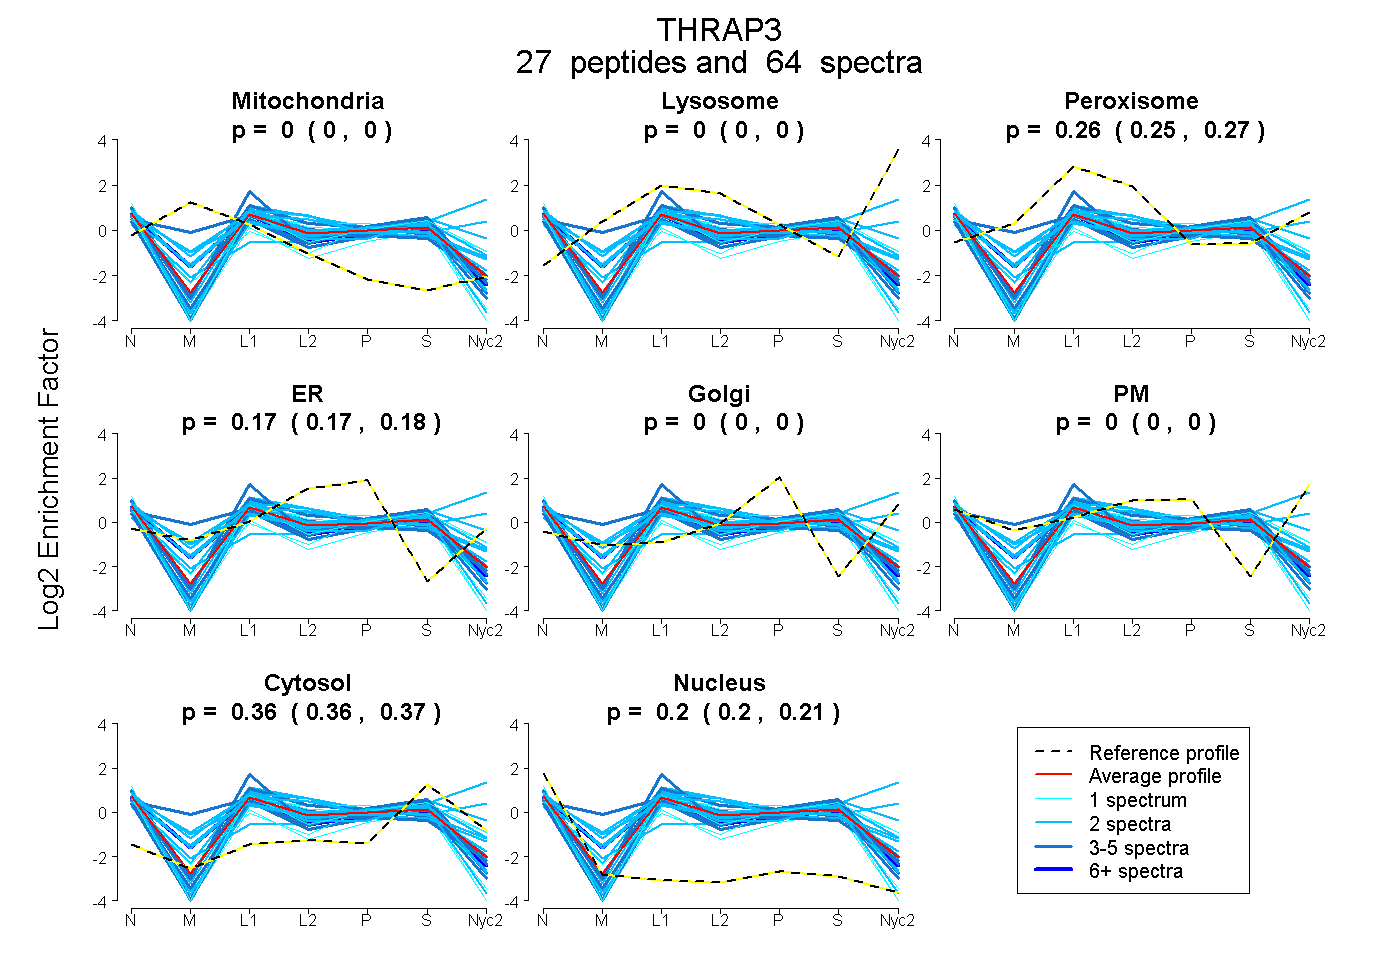
0.000 | 0.000
0.000 | 0.000
0.255 | 0.267
0.170 | 0.177
0.000 | 0.000
0.000 | 0.000
0.356 | 0.367
0.199 | 0.207
2peptides
spectra
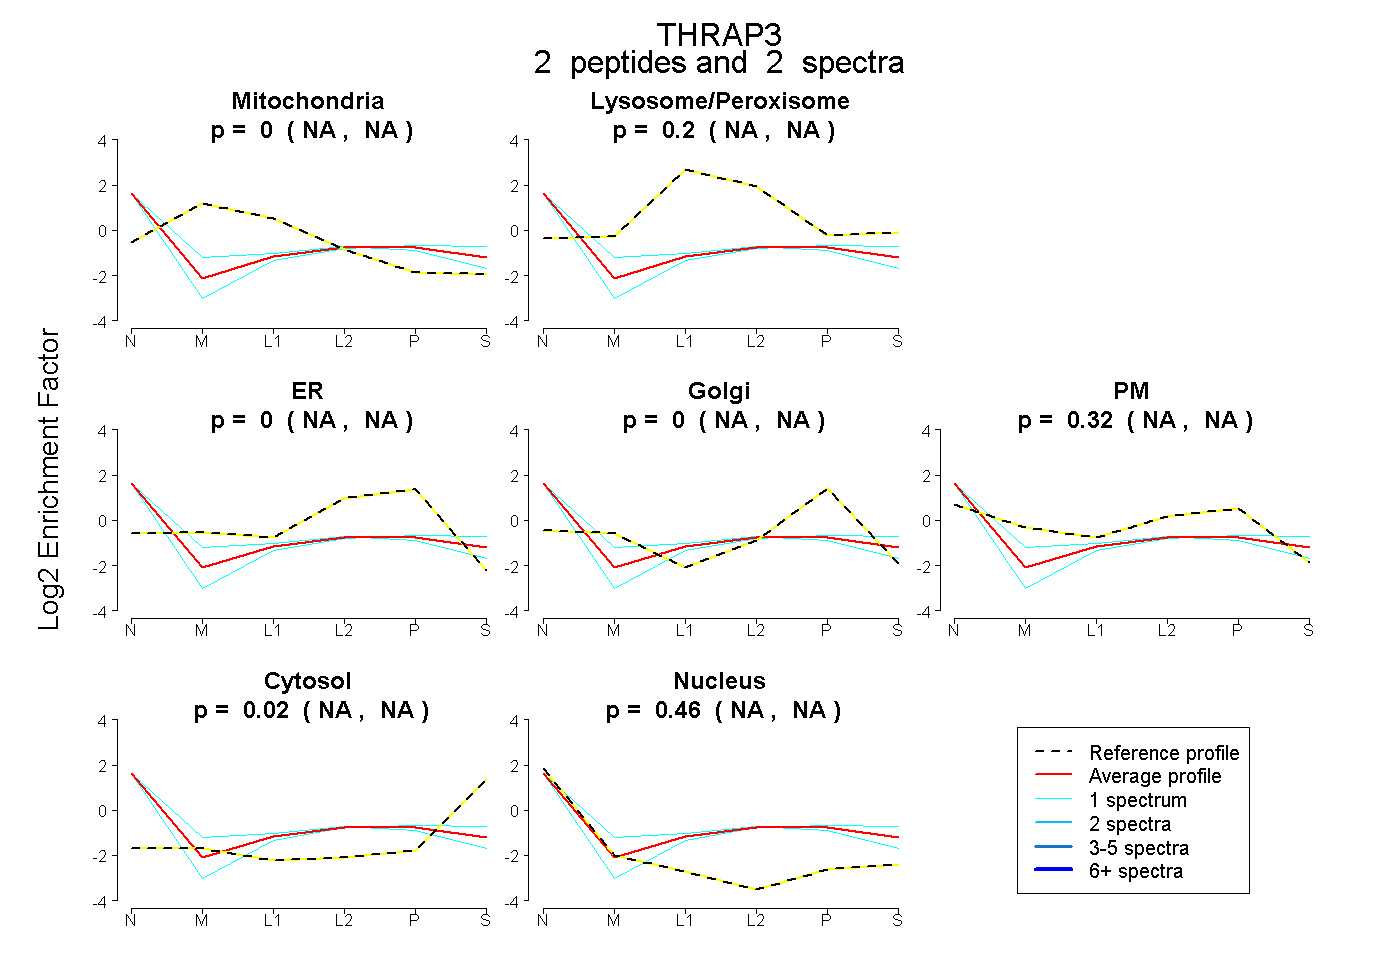
NA | NA
NA | NA
NA | NA
NA | NA
NA | NA
NA | NA
NA | NA
4peptides
spectra
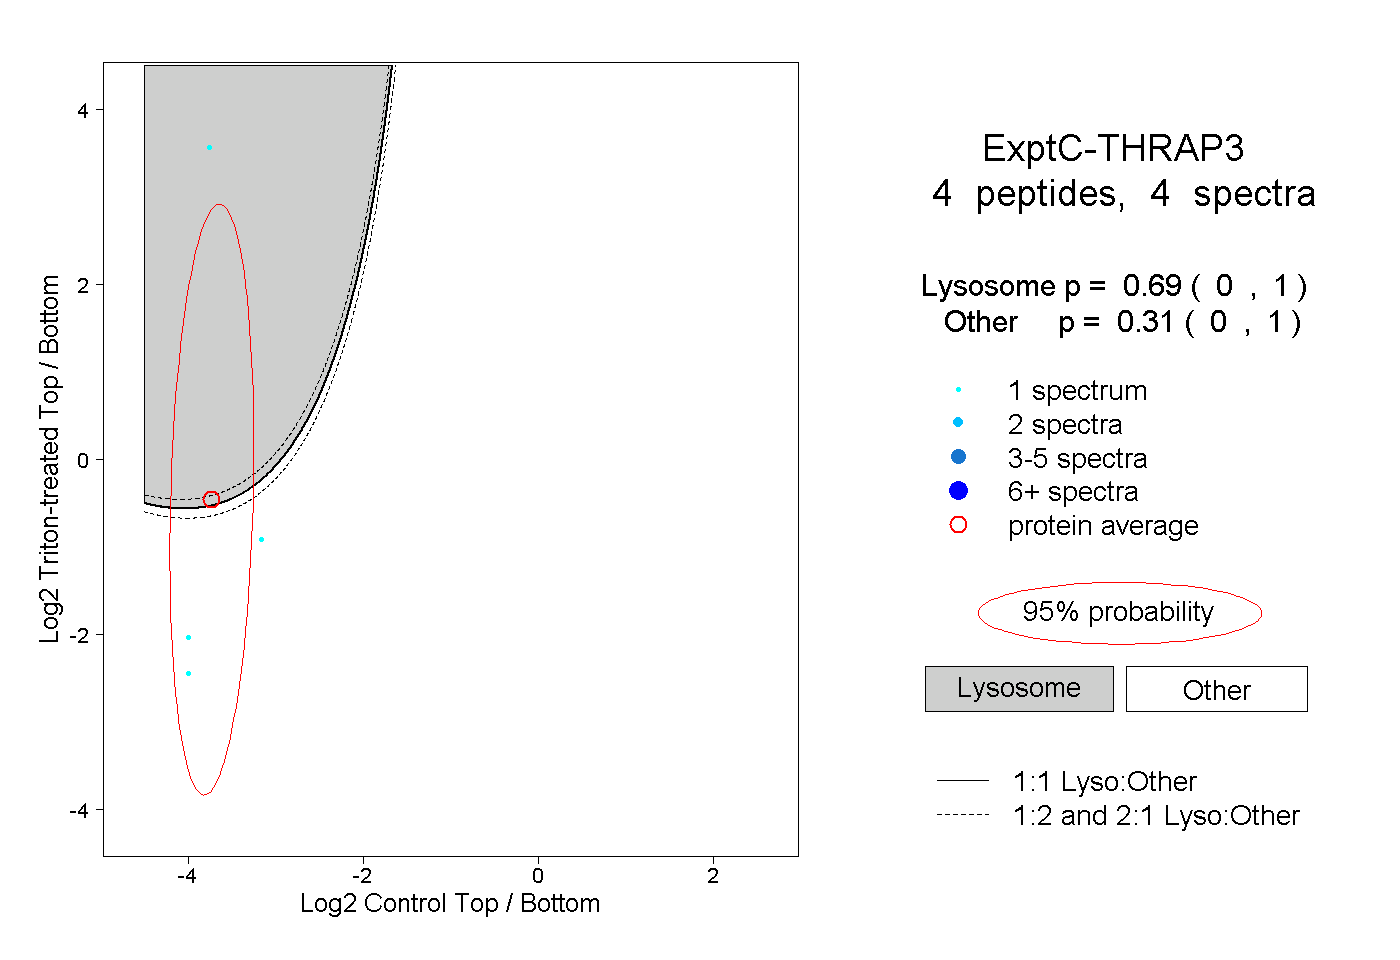
0.000 | 1.000
0.000 | 1.000