 27
27peptides
spectra
0.000 | 0.000
0.000 | 0.000
0.255 | 0.267
0.170 | 0.177
0.000 | 0.000
0.000 | 0.000
0.356 | 0.367
0.199 | 0.207
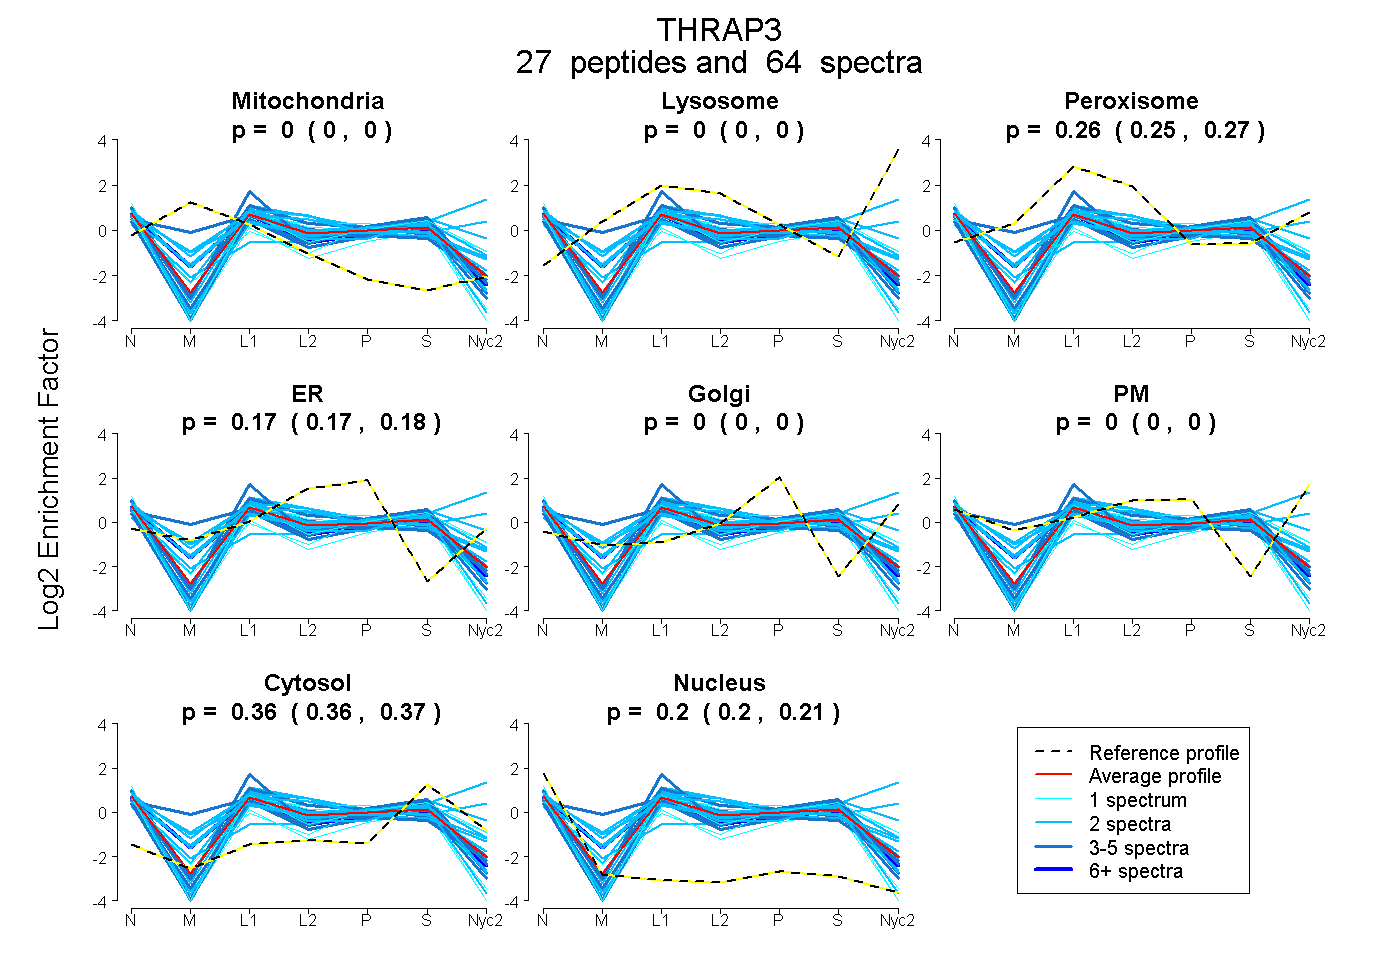
| Plot | Mito | Lyso | Perox | ER | Golgi | PM | Cytosol | Nucleus | |||||
| Expt A |
27 peptides |
64 spectra |
|
0.000 0.000 | 0.000 |
0.000 0.000 | 0.000 |
0.261 0.255 | 0.267 |
0.173 0.170 | 0.177 |
0.000 0.000 | 0.000 |
0.000 0.000 | 0.000 |
0.362 0.356 | 0.367 |
0.203 0.199 | 0.207 |
| 2 spectra, WESLHAGK | 0.000 | 0.000 | 0.430 | 0.156 | 0.000 | 0.000 | 0.219 | 0.195 | ||
| 4 spectra, MDSFDEDLARPSGLLAQER | 0.000 | 0.000 | 0.315 | 0.220 | 0.000 | 0.000 | 0.244 | 0.222 | ||
| 2 spectra, SPEIHR | 0.000 | 0.000 | 0.490 | 0.165 | 0.000 | 0.000 | 0.136 | 0.209 | ||
| 1 spectrum, YLEEQK | 0.000 | 0.000 | 0.164 | 0.180 | 0.000 | 0.000 | 0.560 | 0.097 | ||
| 3 spectra, SDPFAPK | 0.000 | 0.000 | 0.176 | 0.085 | 0.000 | 0.000 | 0.490 | 0.249 | ||
| 2 spectra, EESTTGFDK | 0.000 | 0.000 | 0.373 | 0.189 | 0.000 | 0.000 | 0.439 | 0.000 | ||
| 3 spectra, SSFSLTR | 0.265 | 0.000 | 0.289 | 0.138 | 0.000 | 0.000 | 0.176 | 0.131 | ||
| 2 spectra, IDISPSTFR | 0.000 | 0.000 | 0.334 | 0.148 | 0.000 | 0.000 | 0.294 | 0.224 | ||
| 1 spectrum, GNEQEAAK | 0.000 | 0.000 | 0.244 | 0.155 | 0.000 | 0.000 | 0.418 | 0.184 | ||
| 2 spectra, SSSPPPR | 0.000 | 0.000 | 0.394 | 0.032 | 0.000 | 0.000 | 0.305 | 0.270 | ||
| 8 spectra, GGFSDADVK | 0.000 | 0.000 | 0.371 | 0.091 | 0.000 | 0.000 | 0.255 | 0.283 | ||
| 4 spectra, SPLQSVVVR | 0.000 | 0.000 | 0.054 | 0.218 | 0.000 | 0.000 | 0.588 | 0.140 | ||
| 2 spectra, YYLHDDR | 0.000 | 0.000 | 0.386 | 0.154 | 0.000 | 0.000 | 0.218 | 0.243 | ||
| 1 spectrum, DLVHSNK | 0.000 | 0.000 | 0.233 | 0.206 | 0.000 | 0.000 | 0.464 | 0.097 | ||
| 1 spectrum, EEEWDPEYTPK | 0.000 | 0.000 | 0.096 | 0.084 | 0.000 | 0.000 | 0.370 | 0.450 | ||
| 2 spectra, QAYSPR | 0.000 | 0.022 | 0.000 | 0.000 | 0.000 | 0.457 | 0.520 | 0.000 | ||
| 5 spectra, SIFQHIQSAQSQR | 0.000 | 0.000 | 0.371 | 0.100 | 0.000 | 0.000 | 0.316 | 0.213 | ||
| 2 spectra, VIAGASK | 0.000 | 0.000 | 0.152 | 0.158 | 0.000 | 0.000 | 0.385 | 0.305 | ||
| 2 spectra, EQTFSGGTSQDIK | 0.000 | 0.000 | 0.186 | 0.207 | 0.000 | 0.000 | 0.388 | 0.219 | ||
| 2 spectra, EAQVNVR | 0.000 | 0.000 | 0.282 | 0.177 | 0.000 | 0.000 | 0.429 | 0.112 | ||
| 2 spectra, GDFSSGK | 0.000 | 0.000 | 0.207 | 0.202 | 0.000 | 0.000 | 0.373 | 0.219 | ||
| 4 spectra, ASVSDLSPR | 0.000 | 0.000 | 0.191 | 0.168 | 0.000 | 0.000 | 0.361 | 0.280 | ||
| 1 spectrum, HGLTHEELK | 0.000 | 0.000 | 0.106 | 0.315 | 0.000 | 0.000 | 0.363 | 0.215 | ||
| 1 spectrum, DSRPSQAAGDNQGDEAK | 0.000 | 0.000 | 0.172 | 0.244 | 0.000 | 0.000 | 0.315 | 0.269 | ||
| 1 spectrum, SPPATGSAYGSSQK | 0.000 | 0.000 | 0.085 | 0.198 | 0.000 | 0.000 | 0.378 | 0.338 | ||
| 2 spectra, TDTEKPFR | 0.000 | 0.000 | 0.092 | 0.252 | 0.000 | 0.000 | 0.494 | 0.163 | ||
| 2 spectra, SNWQNYR | 0.000 | 0.000 | 0.297 | 0.000 | 0.000 | 0.347 | 0.314 | 0.042 |
| Plot | Mito | Lyso or Perox | ER | Golgi | PM | Cytosol | Nucleus | ||||||
| Expt B |
2 peptides |
2 spectra |
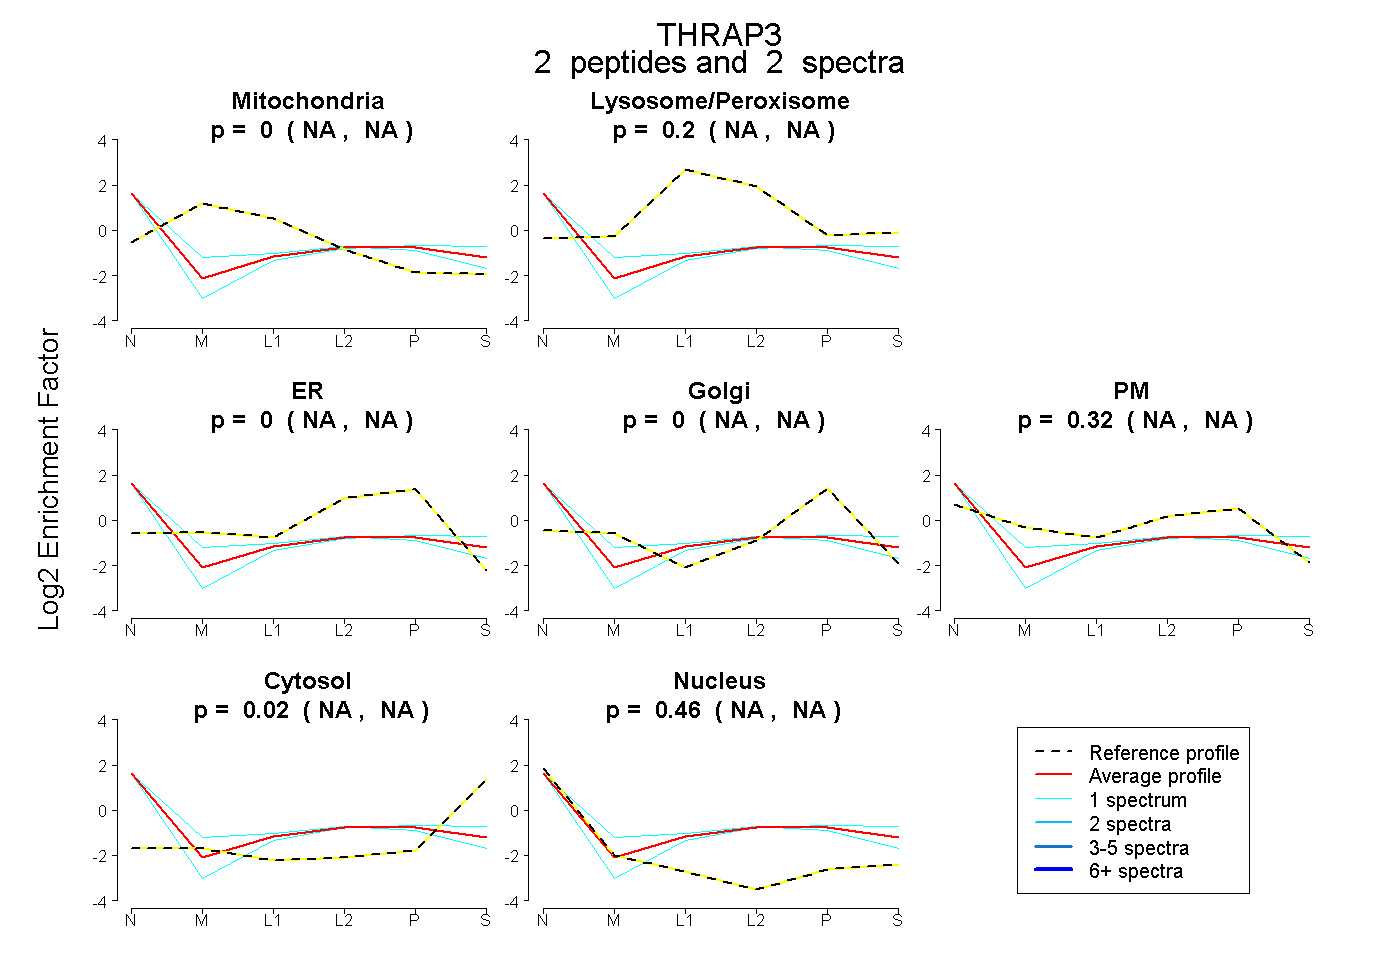 |
0.000 NA | NA |
0.205 NA | NA |
0.000 NA | NA |
0.000 NA | NA |
0.321 NA | NA |
0.018 NA | NA |
0.457 NA | NA |
|||
| Plot | Lyso | Other | |||||||||||
| Expt C |
4 peptides |
4 spectra |
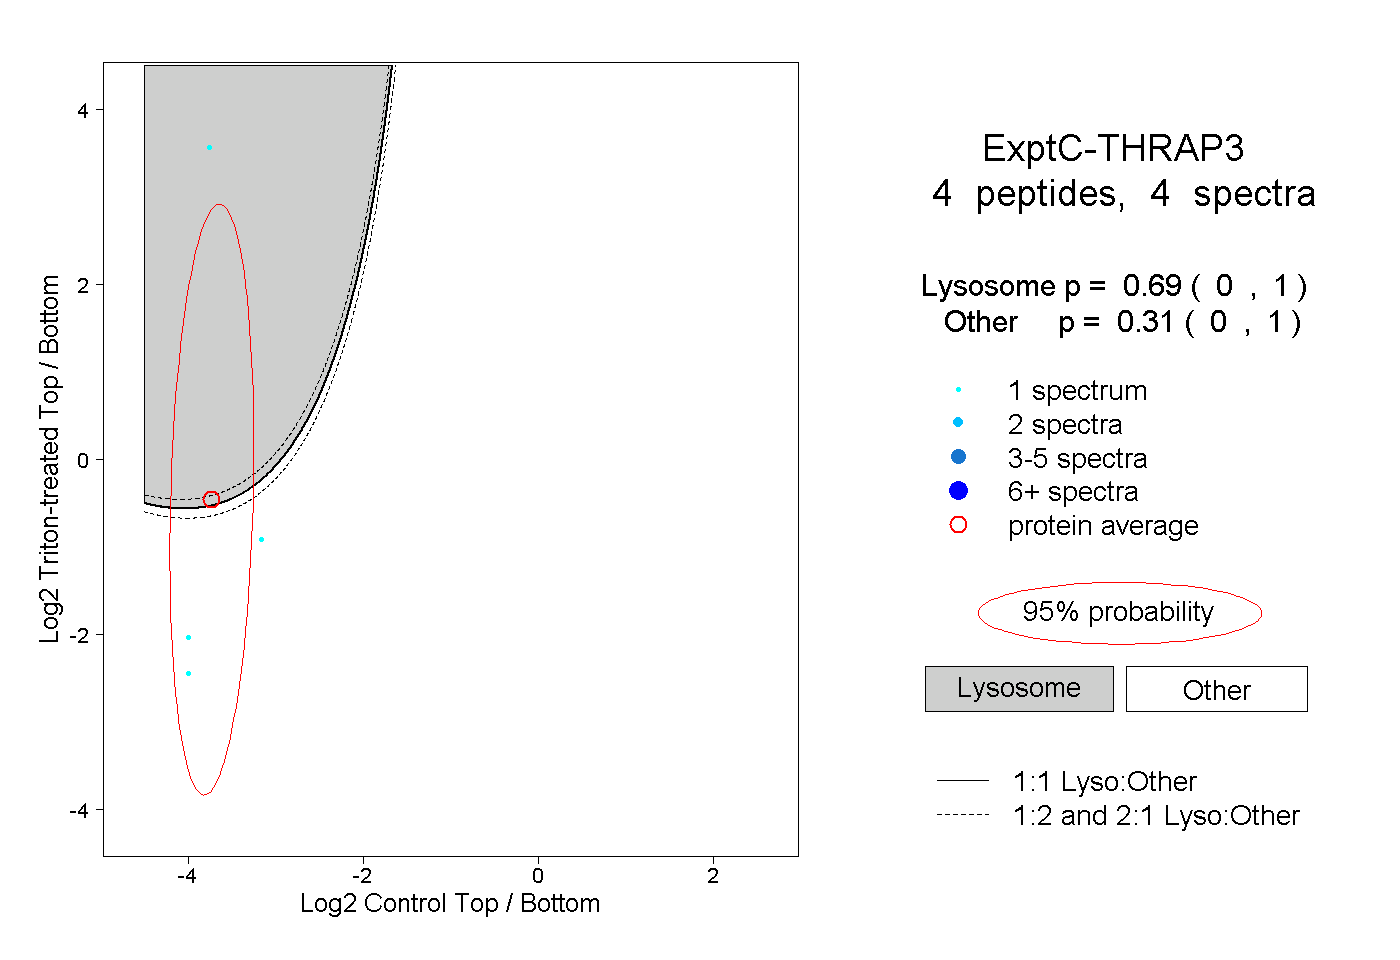 |
0.690 0.000 | 1.000 |
0.310 0.000 | 1.000 |