 7
7peptides
spectra

0.016 | 0.199
0.000 | 0.000
0.000 | 0.043
0.147 | 0.434
0.000 | 0.228
0.000 | 0.000
0.000 | 0.000
0.391 | 0.517
1peptide
spectrum
NA | NA
NA | NA
NA | NA
NA | NA
NA | NA
NA | NA
NA | NA
| Plot | Mito | Lyso | Perox | ER | Golgi | PM | Cytosol | Nucleus | |||||
| Expt A |
7 peptides |
9 spectra |
|
0.121 0.016 | 0.199 |
0.000 0.000 | 0.000 |
0.000 0.000 | 0.043 |
0.367 0.147 | 0.434 |
0.047 0.000 | 0.228 |
0.000 0.000 | 0.000 |
0.000 0.000 | 0.000 |
0.465 0.391 | 0.517 |
||
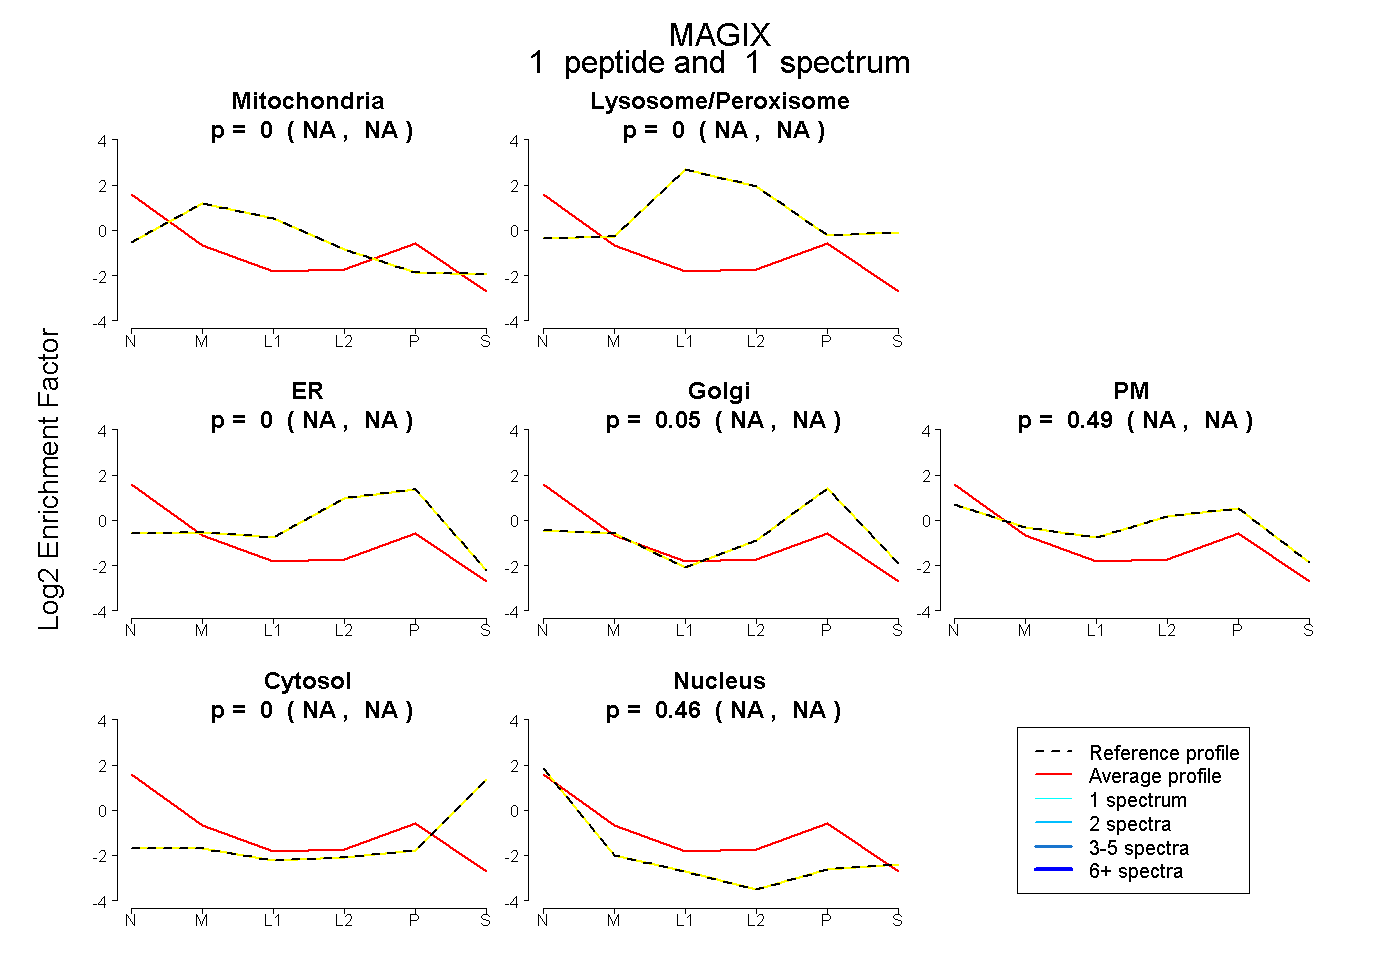
| Plot | Mito | Lyso or Perox | ER | Golgi | PM | Cytosol | Nucleus | ||||||
| Expt B |
1 peptide |
1 spectrum |
|
0.000 NA | NA |
0.000 NA | NA |
0.000 NA | NA |
0.050 NA | NA |
0.491 NA | NA |
0.000 NA | NA |
0.459 NA | NA |