 7
7peptides
spectra

0.016 | 0.199
0.000 | 0.000
0.000 | 0.043
0.147 | 0.434
0.000 | 0.228
0.000 | 0.000
0.000 | 0.000
0.391 | 0.517
| Plot | Mito | Lyso | Perox | ER | Golgi | PM | Cytosol | Nucleus | |||||
| Expt A |
7 peptides |
9 spectra |
|
0.121 0.016 | 0.199 |
0.000 0.000 | 0.000 |
0.000 0.000 | 0.043 |
0.367 0.147 | 0.434 |
0.047 0.000 | 0.228 |
0.000 0.000 | 0.000 |
0.000 0.000 | 0.000 |
0.465 0.391 | 0.517 |
| 1 spectrum, FSVELVR | 0.168 | 0.111 | 0.000 | 0.461 | 0.064 | 0.197 | 0.000 | 0.000 | ||
| 2 spectra, GPAGFGLTLSGGR | 0.060 | 0.000 | 0.000 | 0.277 | 0.000 | 0.000 | 0.000 | 0.663 | ||
| 1 spectrum, GGGVQLAQEMAAGR | 0.000 | 0.000 | 0.000 | 0.123 | 0.064 | 0.000 | 0.000 | 0.813 | ||
| 1 spectrum, LPQATGR | 0.000 | 0.000 | 0.000 | 0.369 | 0.000 | 0.000 | 0.016 | 0.615 | ||
| 1 spectrum, AAADLSALVR | 0.726 | 0.000 | 0.000 | 0.000 | 0.000 | 0.000 | 0.000 | 0.274 | ||
| 2 spectra, GVGLQGSGSPR | 0.000 | 0.000 | 0.000 | 0.181 | 0.037 | 0.000 | 0.000 | 0.783 | ||
| 1 spectrum, SDTQGPR | 0.004 | 0.060 | 0.114 | 0.000 | 0.000 | 0.631 | 0.191 | 0.000 |
| Plot | Mito | Lyso or Perox | ER | Golgi | PM | Cytosol | Nucleus | ||||||
| Expt B |
1 peptide |
1 spectrum |
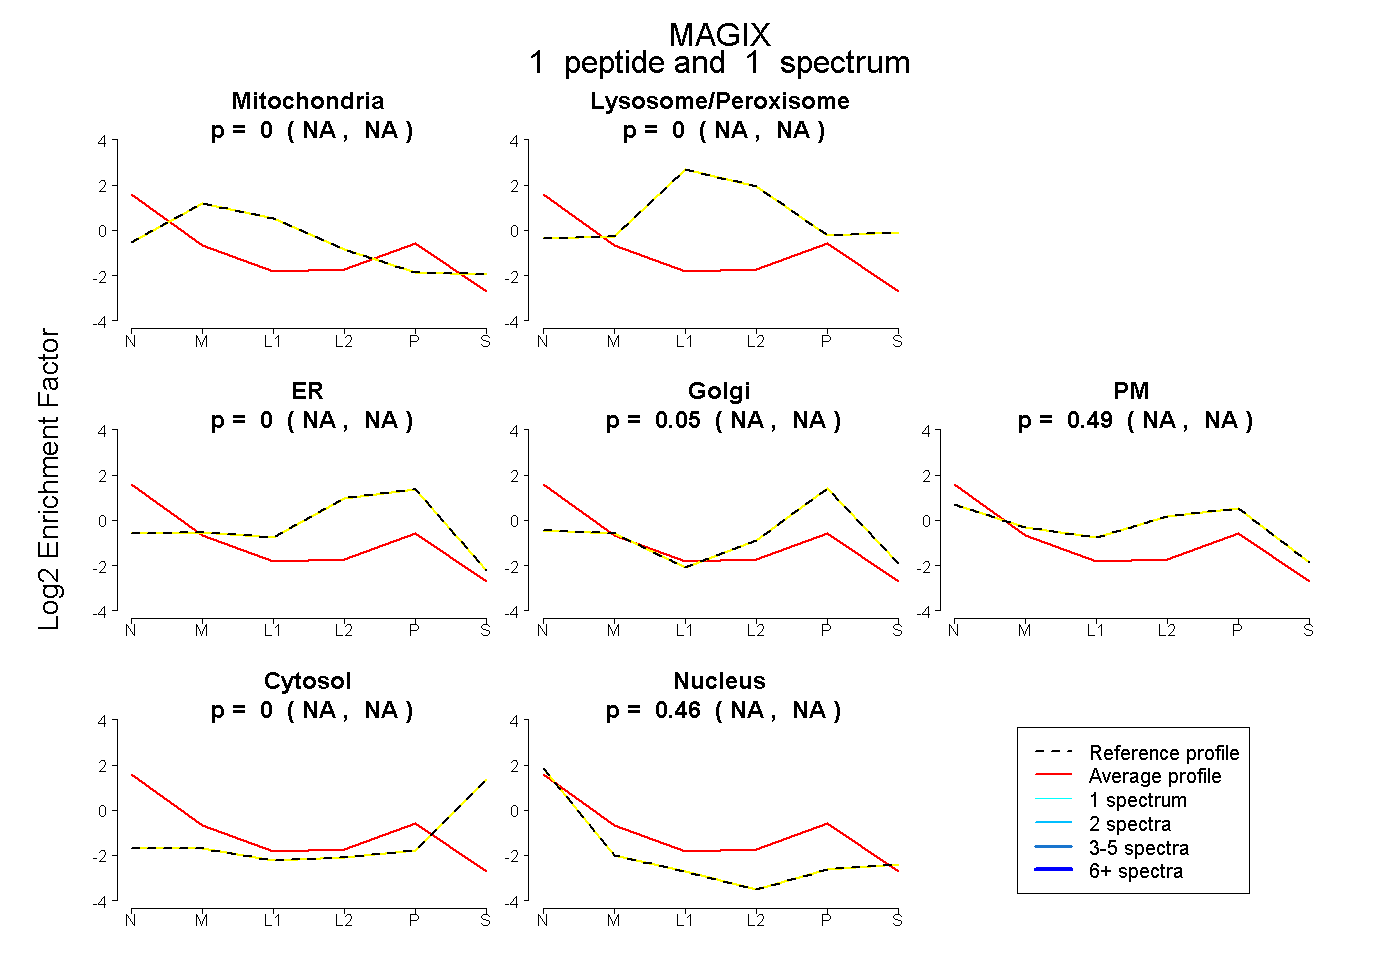 |
0.000 NA | NA |
0.000 NA | NA |
0.000 NA | NA |
0.050 NA | NA |
0.491 NA | NA |
0.000 NA | NA |
0.459 NA | NA |