 4
4peptides
spectra
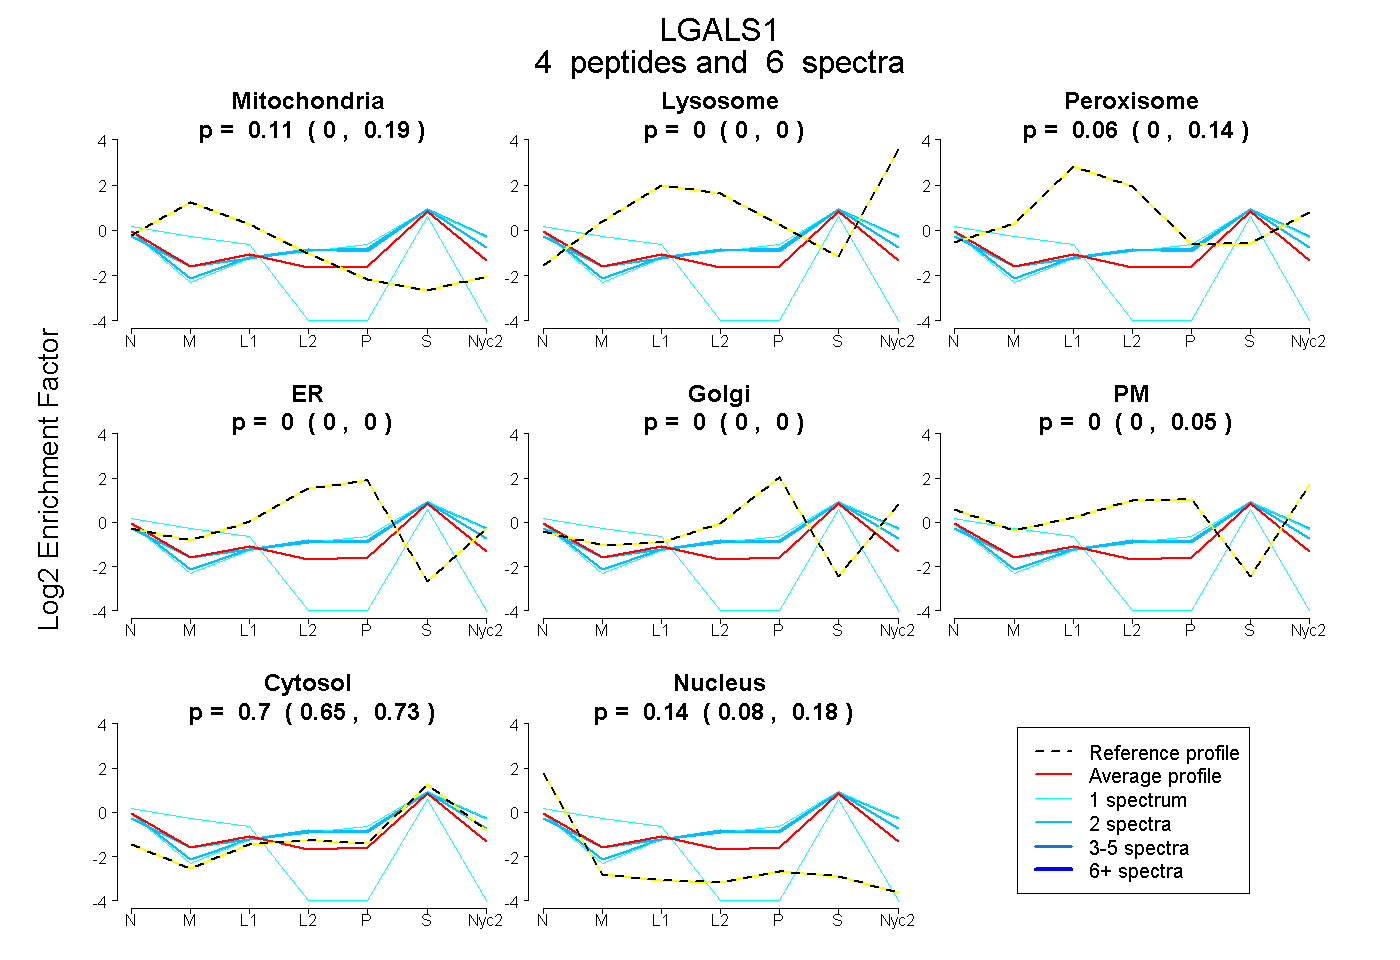
0.000 | 0.190
0.000 | 0.000
0.000 | 0.137
0.000 | 0.000
0.000 | 0.000
0.000 | 0.048
0.652 | 0.729
0.078 | 0.183
1peptide
spectrum
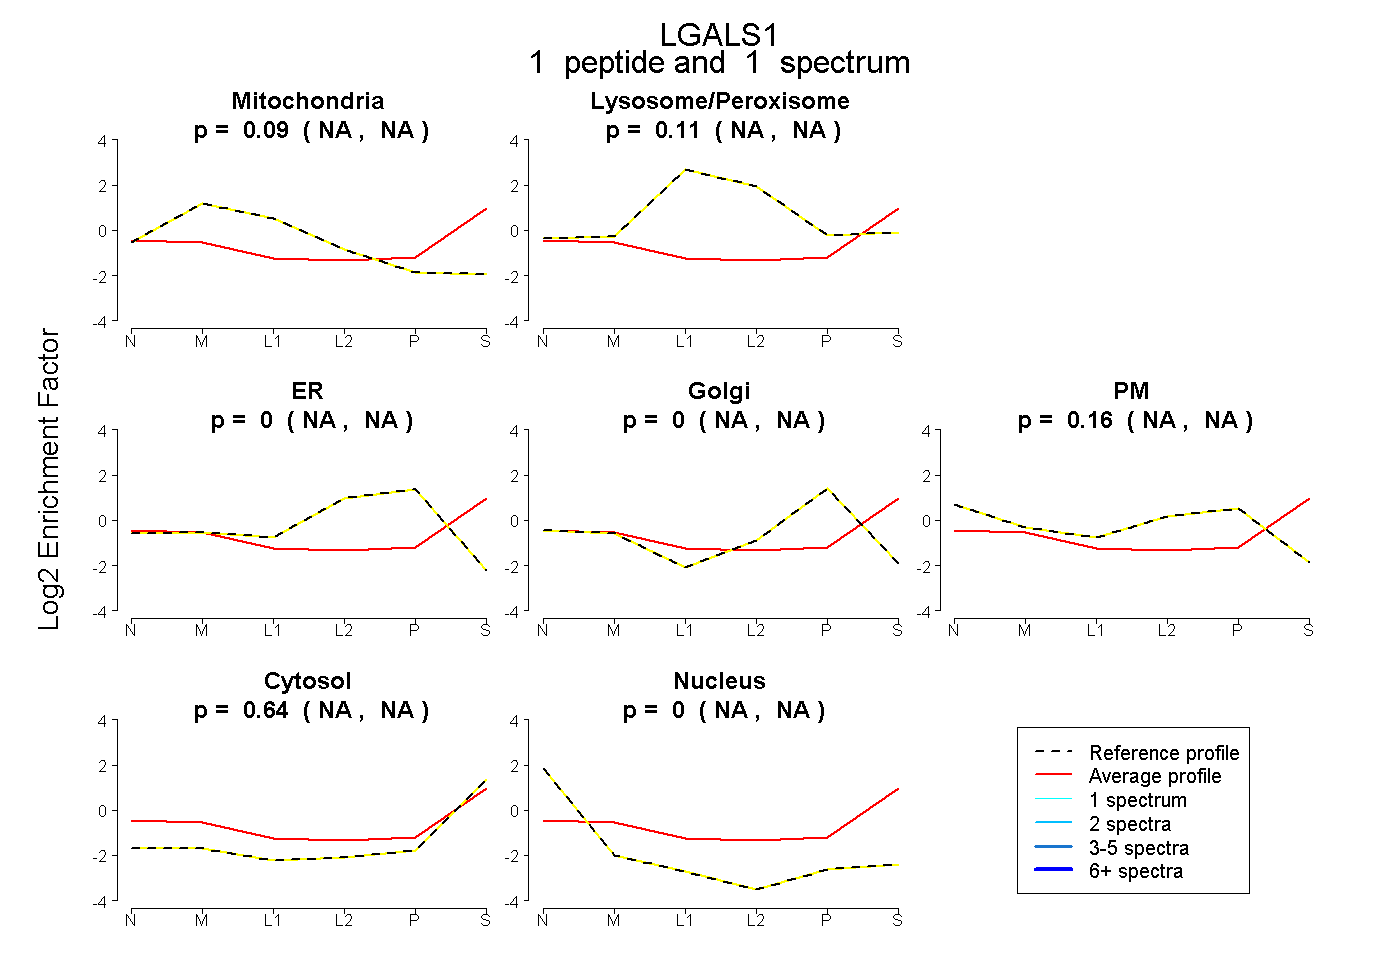
NA | NA
NA | NA
NA | NA
NA | NA
NA | NA
NA | NA
NA | NA
2peptides
spectra
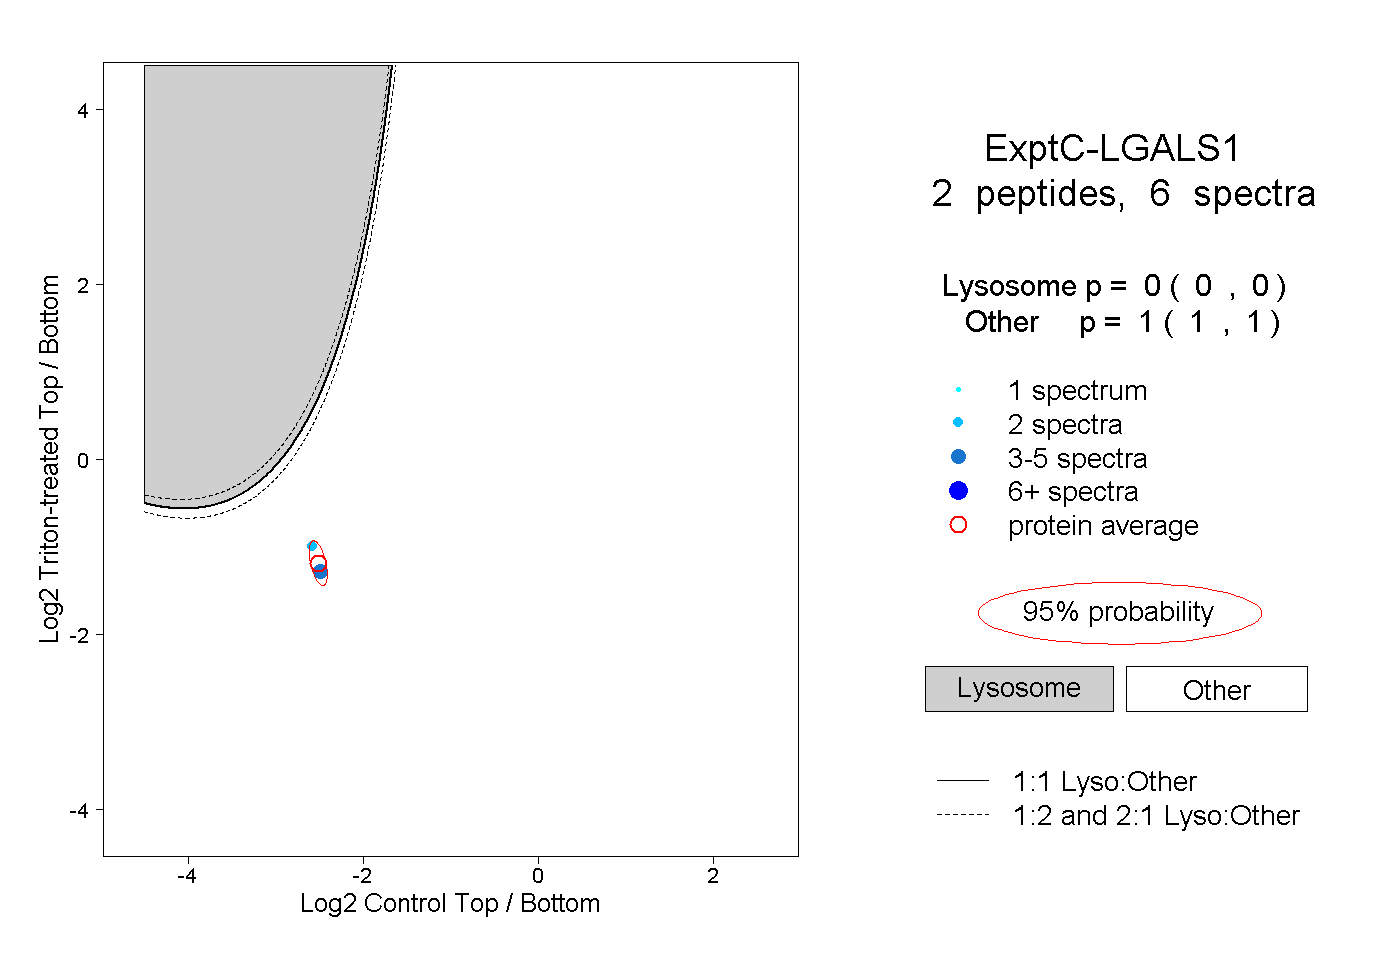
0.000 | 0.000
1.000 | 1.000