 4
4peptides
spectra
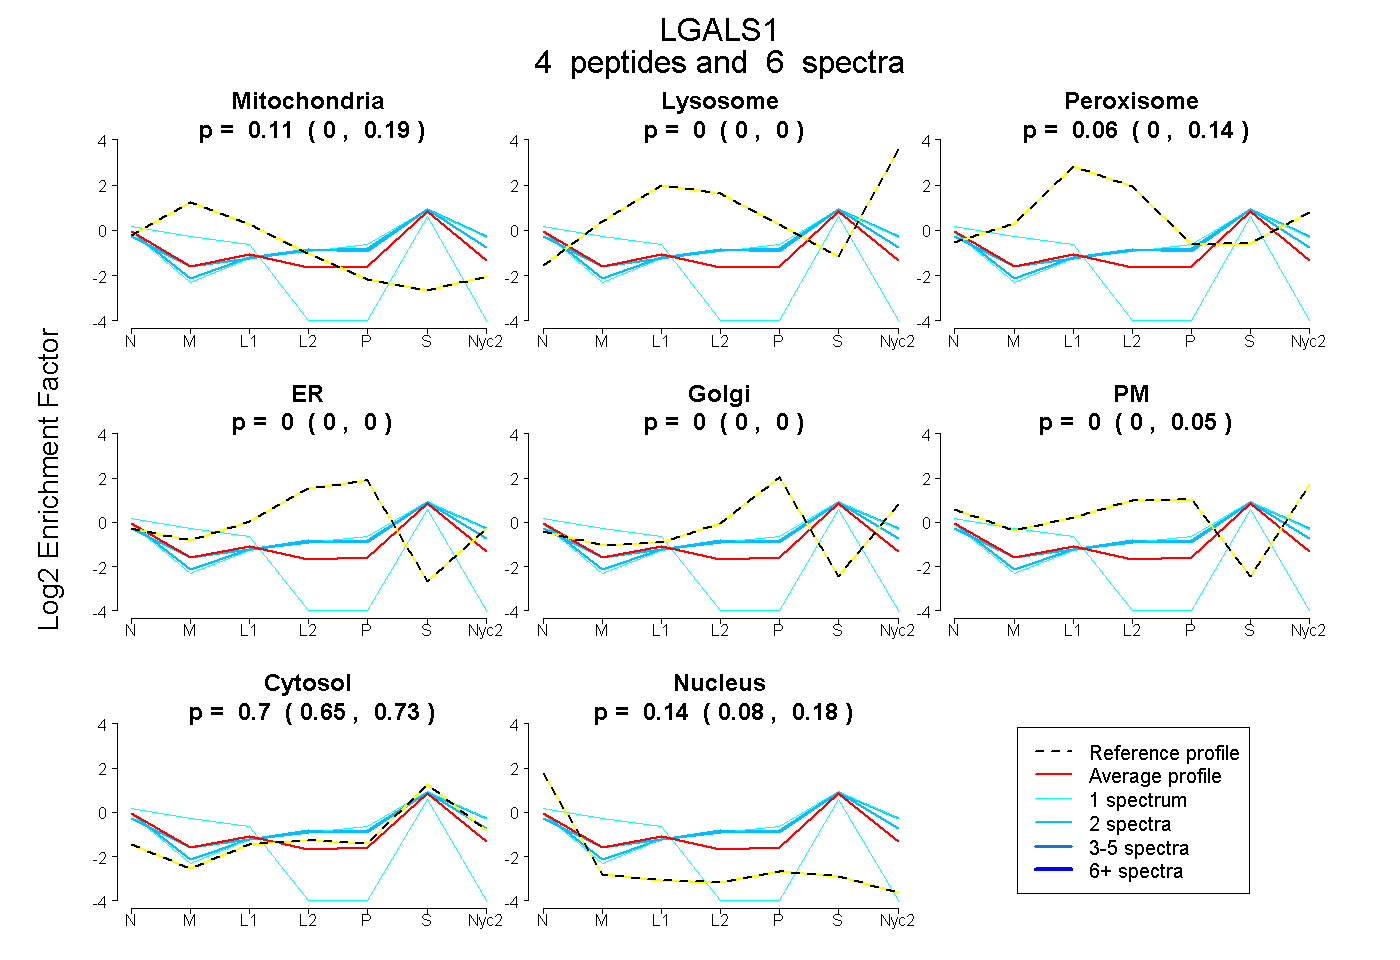
0.000 | 0.190
0.000 | 0.000
0.000 | 0.137
0.000 | 0.000
0.000 | 0.000
0.000 | 0.048
0.652 | 0.729
0.078 | 0.183
| Plot | Mito | Lyso | Perox | ER | Golgi | PM | Cytosol | Nucleus | |||||
| Expt A |
4 peptides |
6 spectra |
|
0.106 0.000 | 0.190 |
0.000 0.000 | 0.000 |
0.059 0.000 | 0.137 |
0.000 0.000 | 0.000 |
0.000 0.000 | 0.000 |
0.000 0.000 | 0.048 |
0.696 0.652 | 0.729 |
0.138 0.078 | 0.183 |
| 2 spectra, SFVLNLGK | 0.016 | 0.000 | 0.042 | 0.000 | 0.000 | 0.150 | 0.739 | 0.054 | ||
| 1 spectrum, LPDGHEFK | 0.000 | 0.000 | 0.000 | 0.000 | 0.000 | 0.200 | 0.771 | 0.029 | ||
| 2 spectra, DDGTWGTEQR | 0.000 | 0.000 | 0.000 | 0.000 | 0.000 | 0.204 | 0.760 | 0.036 | ||
| 1 spectrum, DSNNLCLHFNPR | 0.330 | 0.000 | 0.000 | 0.000 | 0.000 | 0.000 | 0.287 | 0.383 |
| Plot | Mito | Lyso or Perox | ER | Golgi | PM | Cytosol | Nucleus | ||||||
| Expt B |
1 peptide |
1 spectrum |
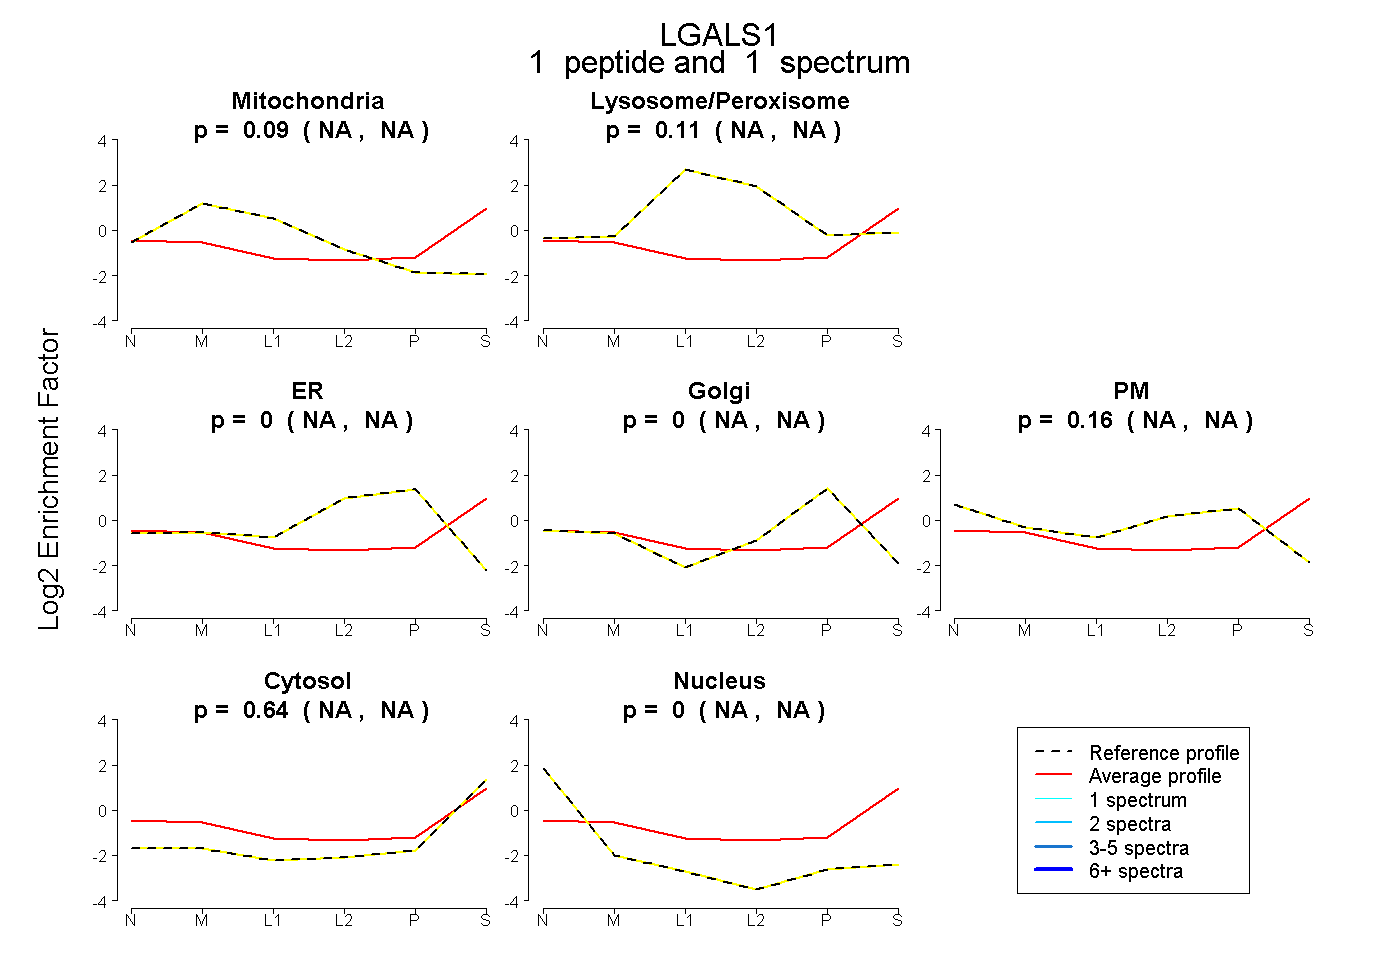 |
0.090 NA | NA |
0.106 NA | NA |
0.000 NA | NA |
0.000 NA | NA |
0.165 NA | NA |
0.638 NA | NA |
0.002 NA | NA |
|||
| Plot | Lyso | Other | |||||||||||
| Expt C |
2 peptides |
6 spectra |
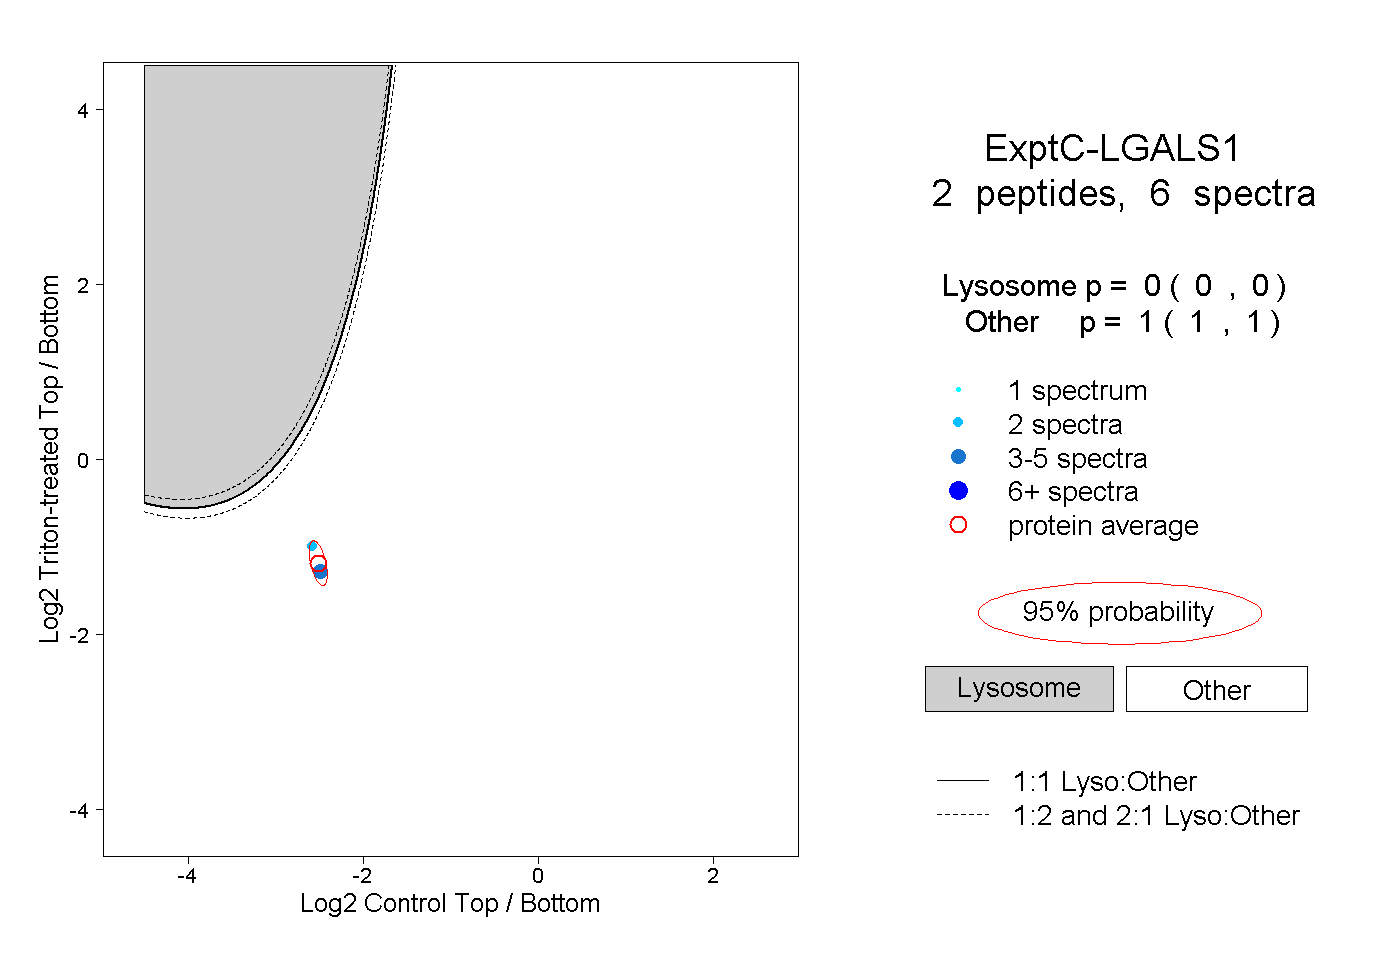 |
0.000 0.000 | 0.000 |
1.000 1.000 | 1.000 |