 15
15peptides
spectra
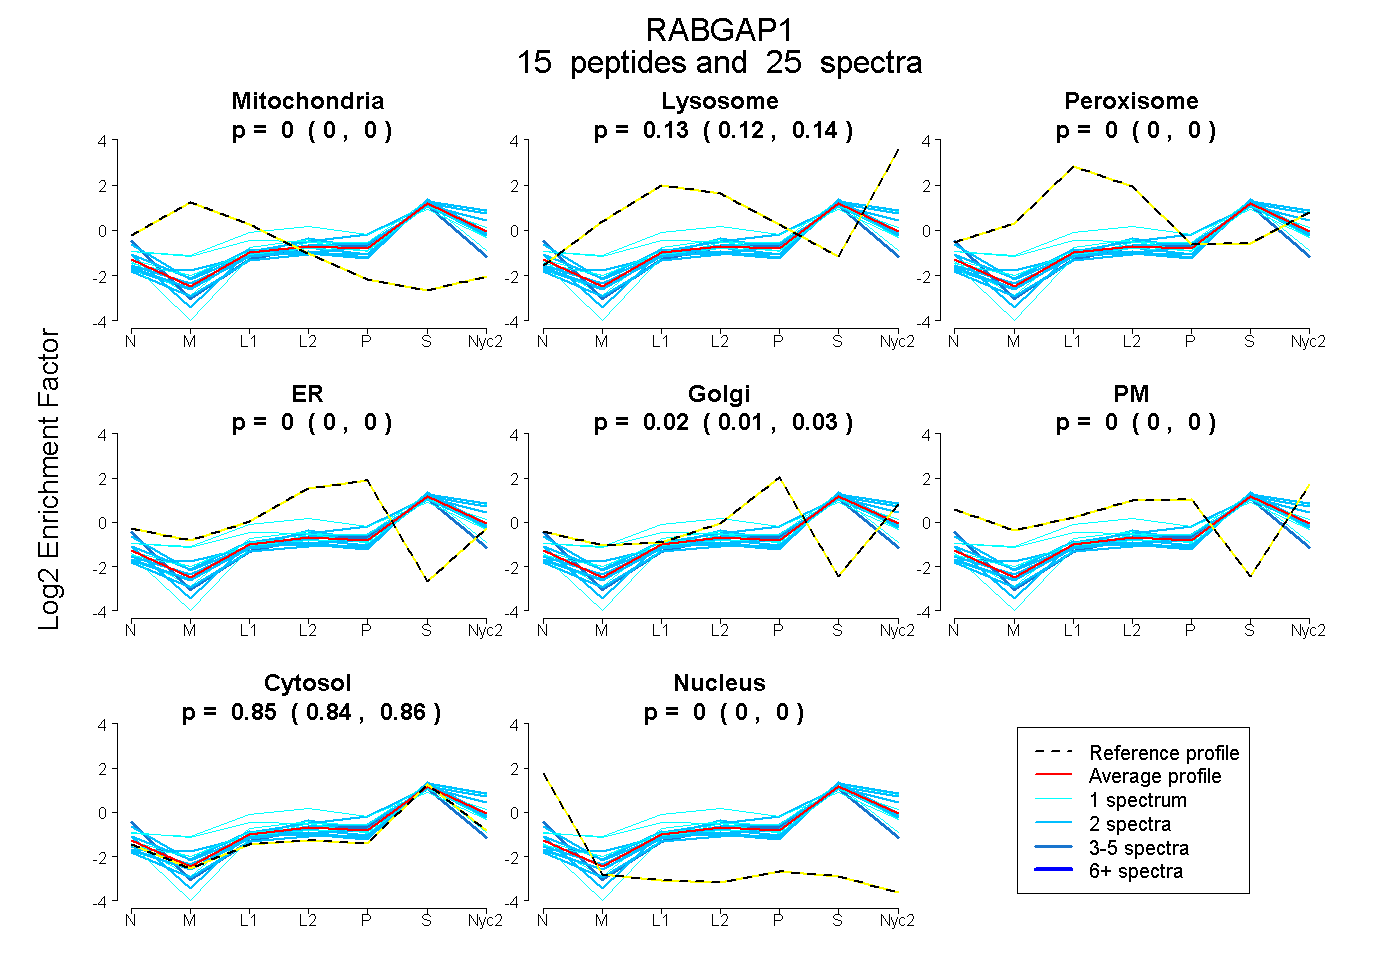
0.000 | 0.000
0.121 | 0.139
0.000 | 0.000
0.000 | 0.002
0.009 | 0.025
0.000 | 0.000
0.844 | 0.855
0.000 | 0.000
2peptides
spectra
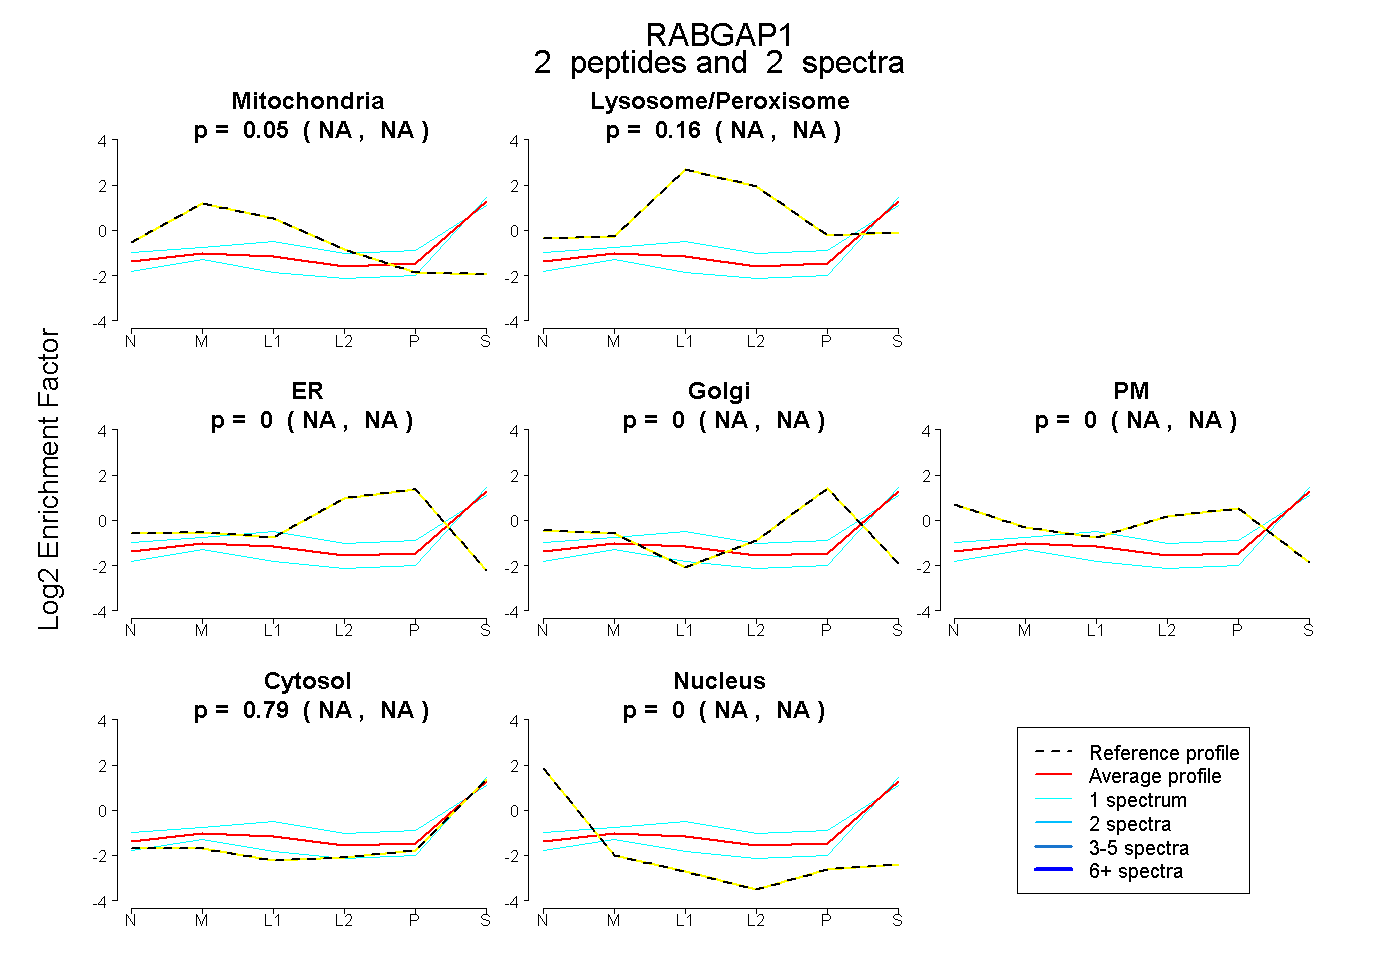
NA | NA
NA | NA
NA | NA
NA | NA
NA | NA
NA | NA
NA | NA
7peptides
spectra
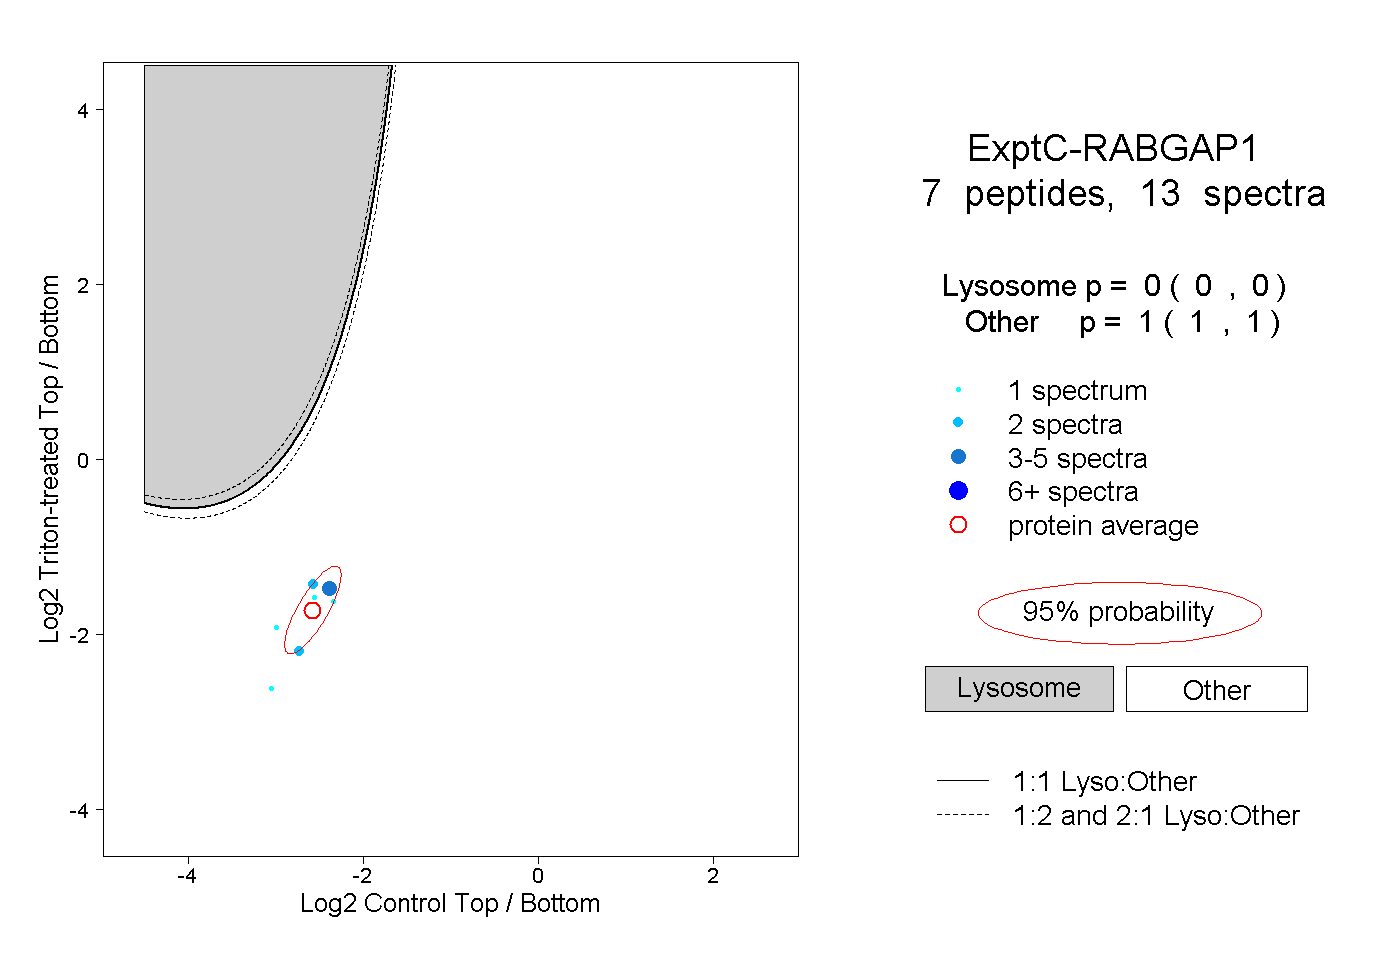
0.000 | 0.000
1.000 | 1.000