 15
15peptides
spectra
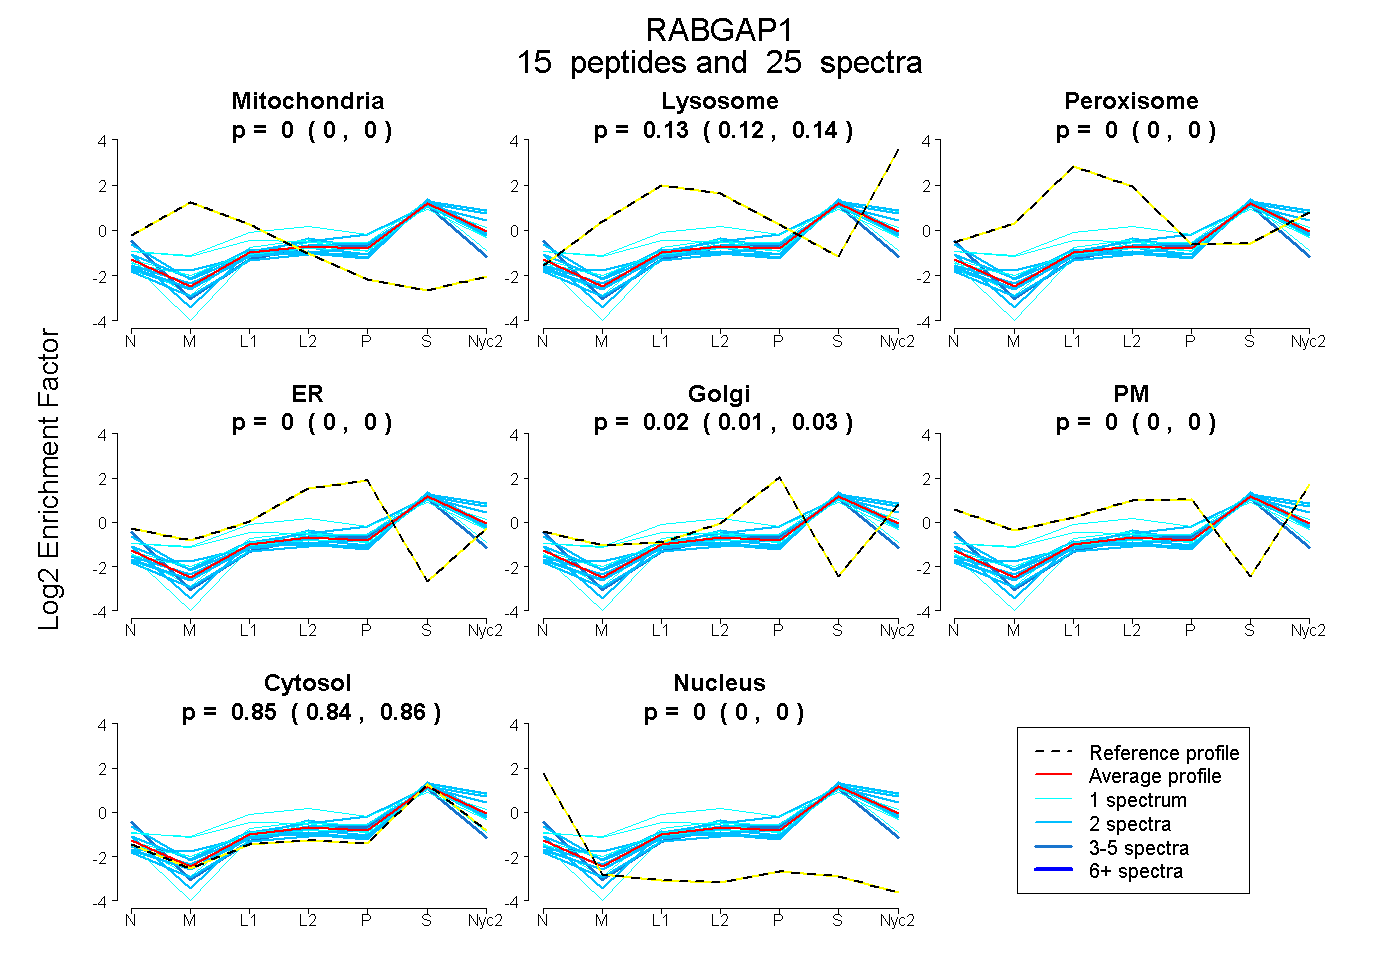
0.000 | 0.000
0.121 | 0.139
0.000 | 0.000
0.000 | 0.002
0.009 | 0.025
0.000 | 0.000
0.844 | 0.855
0.000 | 0.000
| Plot | Mito | Lyso | Perox | ER | Golgi | PM | Cytosol | Nucleus | |||||
| Expt A |
15 peptides |
25 spectra |
|
0.000 0.000 | 0.000 |
0.132 0.121 | 0.139 |
0.000 0.000 | 0.000 |
0.000 0.000 | 0.002 |
0.018 0.009 | 0.025 |
0.000 0.000 | 0.000 |
0.850 0.844 | 0.855 |
0.000 0.000 | 0.000 |
| 1 spectrum, WHLNLNVRPK | 0.013 | 0.133 | 0.160 | 0.000 | 0.000 | 0.004 | 0.689 | 0.000 | ||
| 2 spectra, TFPAHDYFK | 0.000 | 0.215 | 0.000 | 0.000 | 0.000 | 0.000 | 0.785 | 0.000 | ||
| 1 spectrum, QNFEDLHCK | 0.000 | 0.094 | 0.029 | 0.000 | 0.026 | 0.000 | 0.851 | 0.000 | ||
| 1 spectrum, LQLVEAECK | 0.000 | 0.000 | 0.309 | 0.118 | 0.001 | 0.000 | 0.572 | 0.000 | ||
| 1 spectrum, VCSPNER | 0.000 | 0.000 | 0.106 | 0.041 | 0.000 | 0.000 | 0.853 | 0.000 | ||
| 2 spectra, SGVPEALR | 0.000 | 0.096 | 0.000 | 0.000 | 0.000 | 0.000 | 0.904 | 0.000 | ||
| 3 spectra, ILFCVR | 0.000 | 0.000 | 0.000 | 0.114 | 0.000 | 0.000 | 0.843 | 0.044 | ||
| 1 spectrum, ESPQDSAITR | 0.000 | 0.209 | 0.000 | 0.000 | 0.000 | 0.000 | 0.791 | 0.000 | ||
| 2 spectra, IMFDYGLR | 0.000 | 0.049 | 0.000 | 0.000 | 0.000 | 0.000 | 0.951 | 0.000 | ||
| 2 spectra, DLDNAEEK | 0.000 | 0.229 | 0.000 | 0.000 | 0.000 | 0.000 | 0.771 | 0.000 | ||
| 2 spectra, LIDAEDEK | 0.000 | 0.004 | 0.005 | 0.000 | 0.000 | 0.201 | 0.790 | 0.000 | ||
| 2 spectra, DTGGDGQDSLYK | 0.000 | 0.080 | 0.000 | 0.000 | 0.000 | 0.000 | 0.920 | 0.000 | ||
| 2 spectra, LFWPFSK | 0.000 | 0.022 | 0.000 | 0.099 | 0.054 | 0.000 | 0.825 | 0.000 | ||
| 2 spectra, QICSQLSER | 0.000 | 0.193 | 0.000 | 0.000 | 0.000 | 0.000 | 0.807 | 0.000 | ||
| 1 spectrum, LTYLGCASVNAPR | 0.000 | 0.026 | 0.000 | 0.000 | 0.056 | 0.000 | 0.918 | 0.000 |
| Plot | Mito | Lyso or Perox | ER | Golgi | PM | Cytosol | Nucleus | ||||||
| Expt B |
2 peptides |
2 spectra |
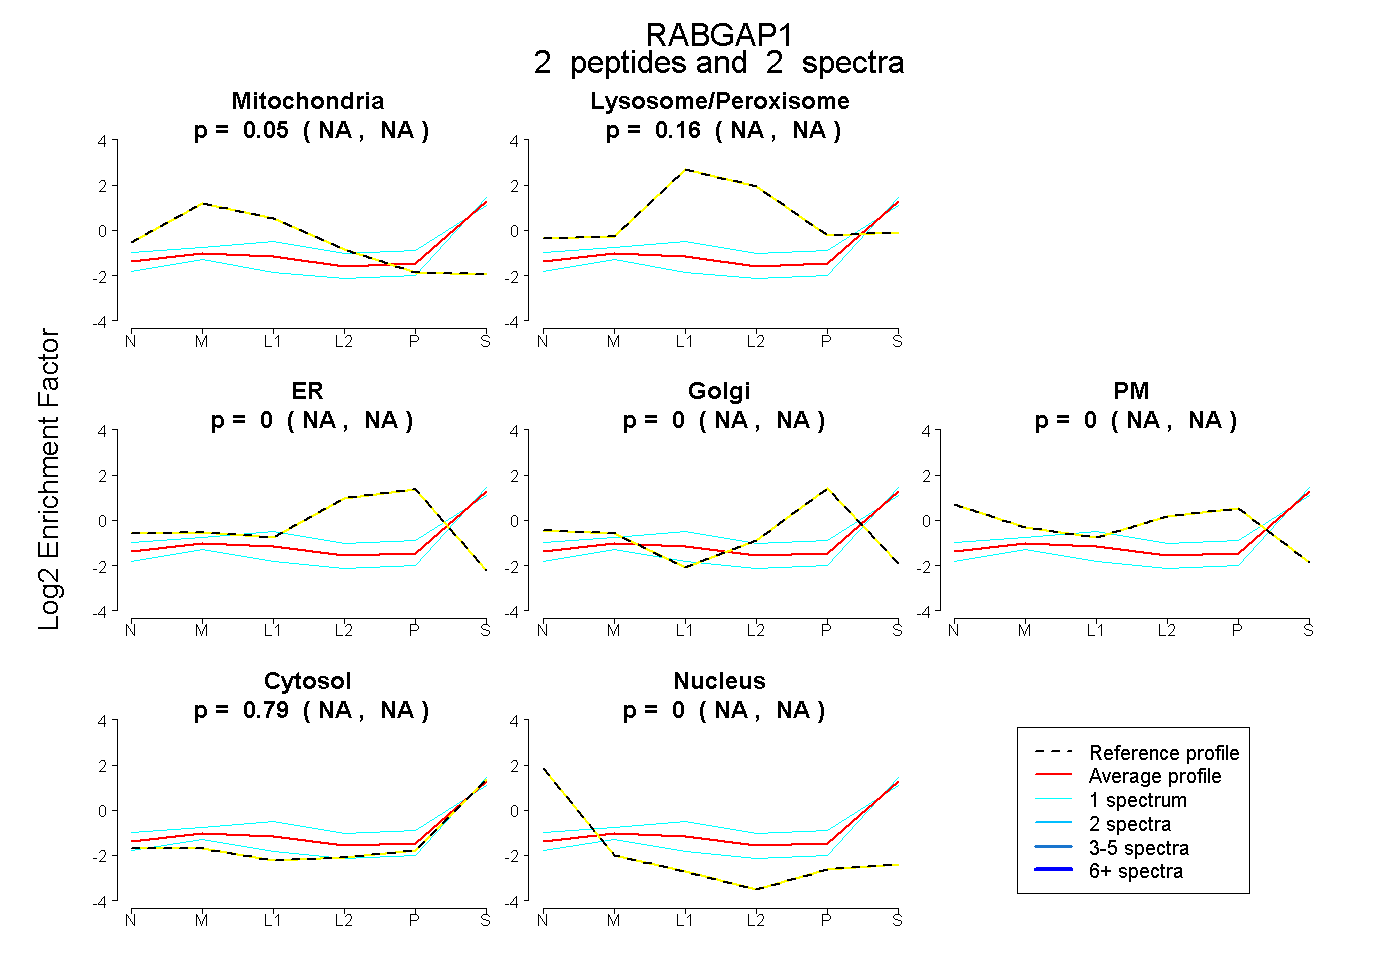 |
0.047 NA | NA |
0.160 NA | NA |
0.000 NA | NA |
0.000 NA | NA |
0.000 NA | NA |
0.793 NA | NA |
0.000 NA | NA |
|||
| Plot | Lyso | Other | |||||||||||
| Expt C |
7 peptides |
13 spectra |
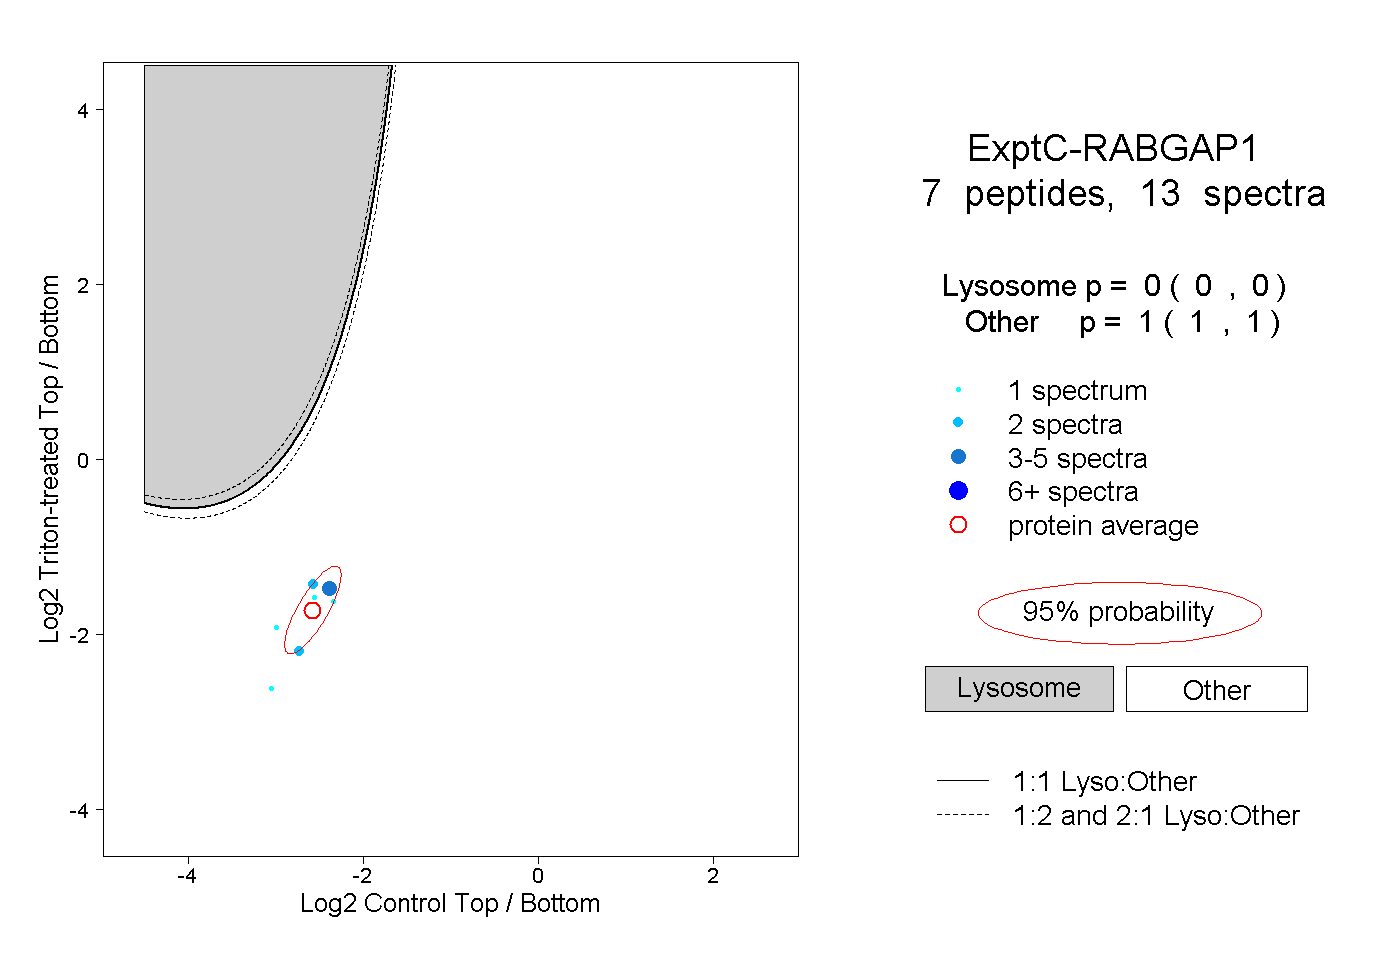 |
0.000 0.000 | 0.000 |
1.000 1.000 | 1.000 |