 5
5peptides
spectra
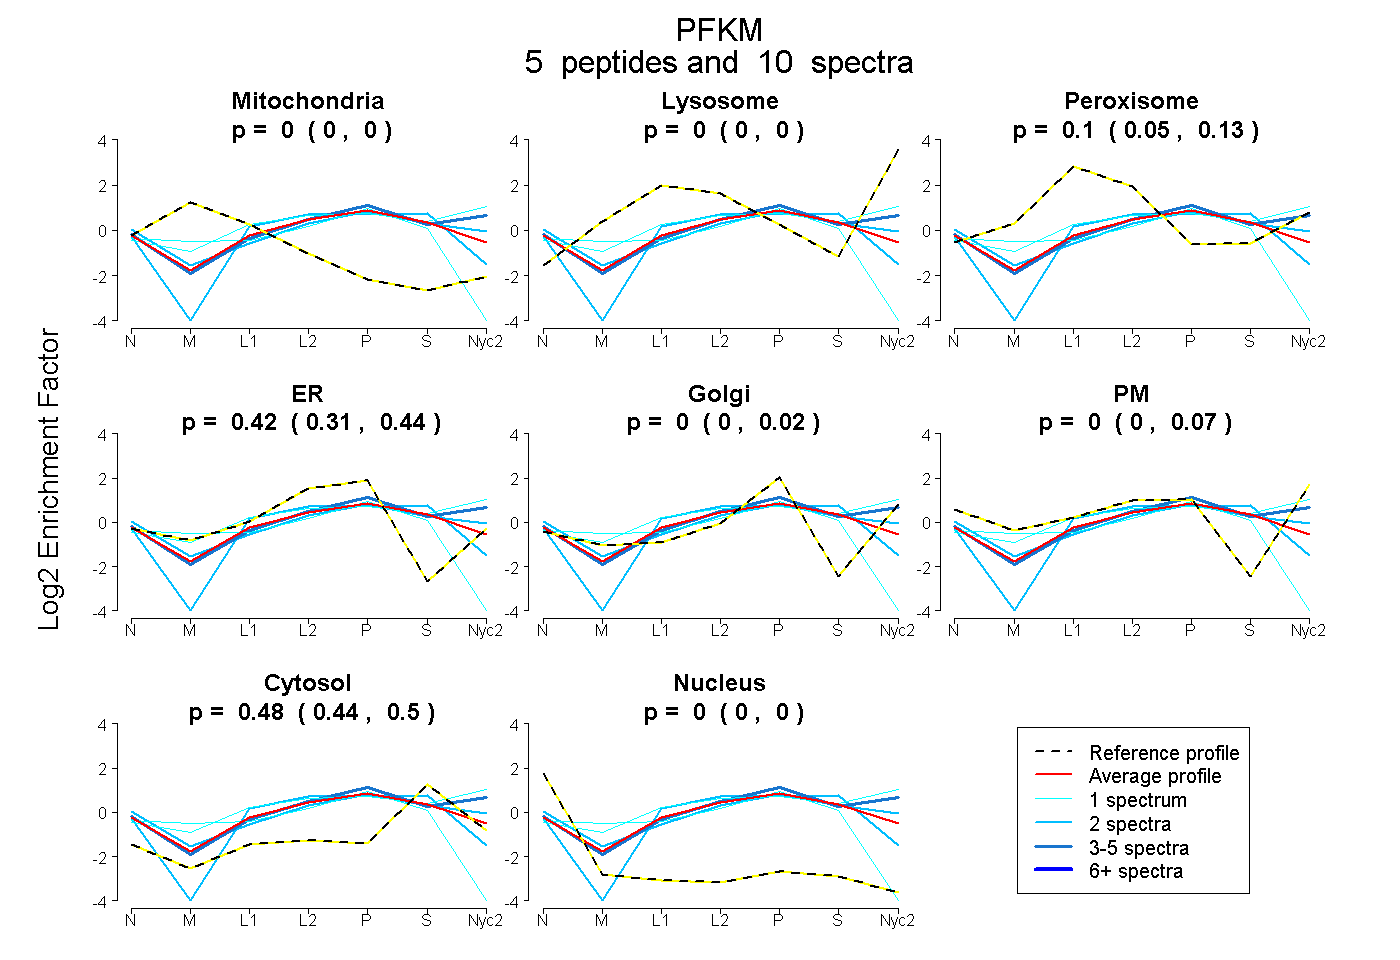
0.000 | 0.000
0.000 | 0.000
0.053 | 0.133
0.308 | 0.445
0.000 | 0.018
0.000 | 0.066
0.443 | 0.502
0.000 | 0.000
3peptides
spectra
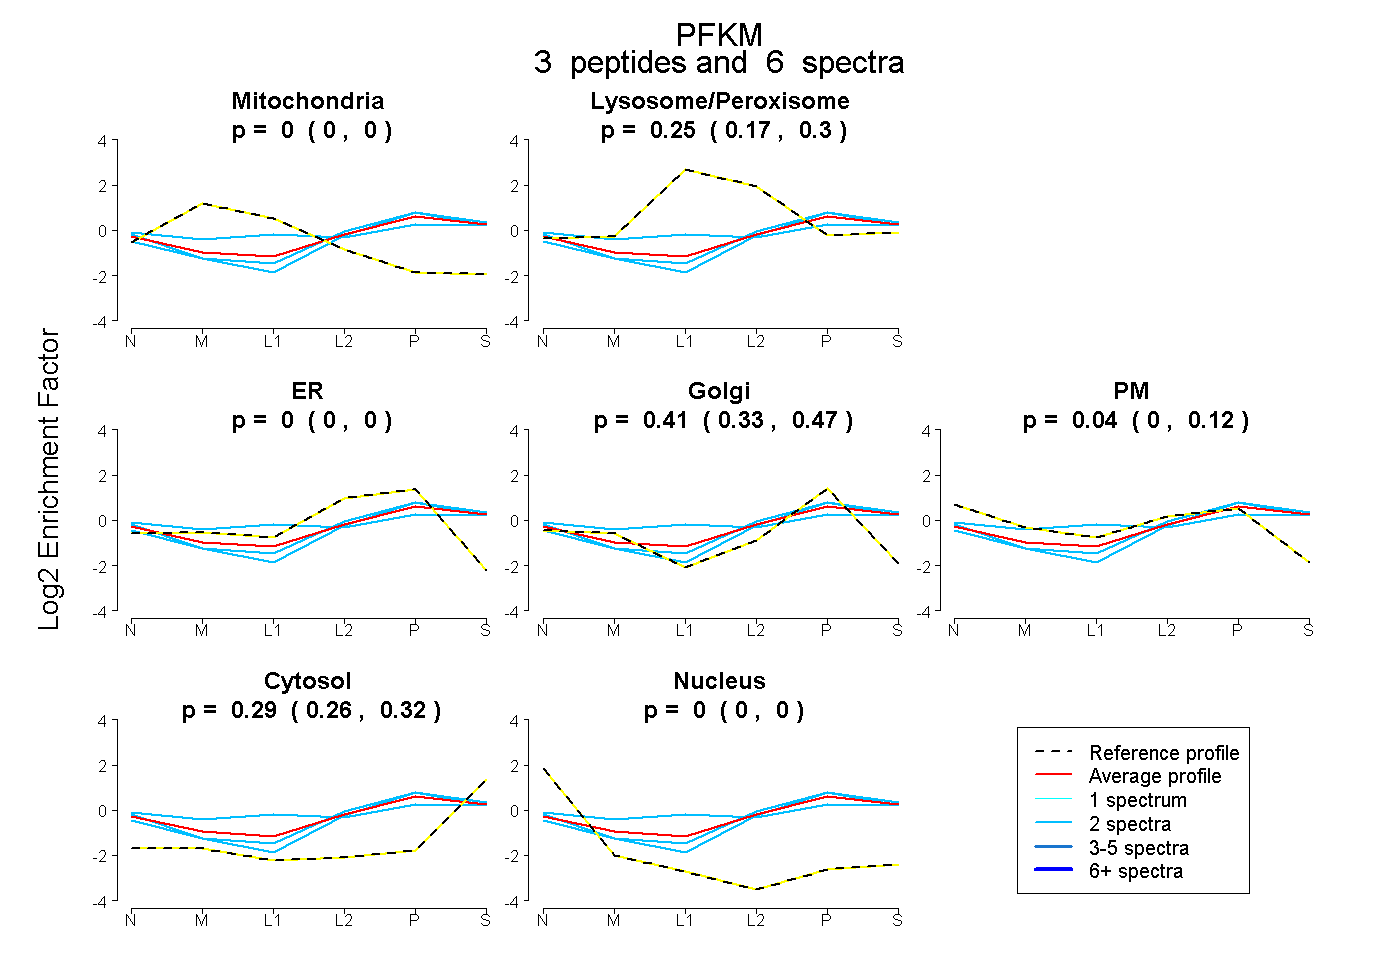
0.000 | 0.000
0.166 | 0.303
0.000 | 0.002
0.328 | 0.466
0.000 | 0.123
0.262 | 0.322
0.000 | 0.000
6peptides
spectra
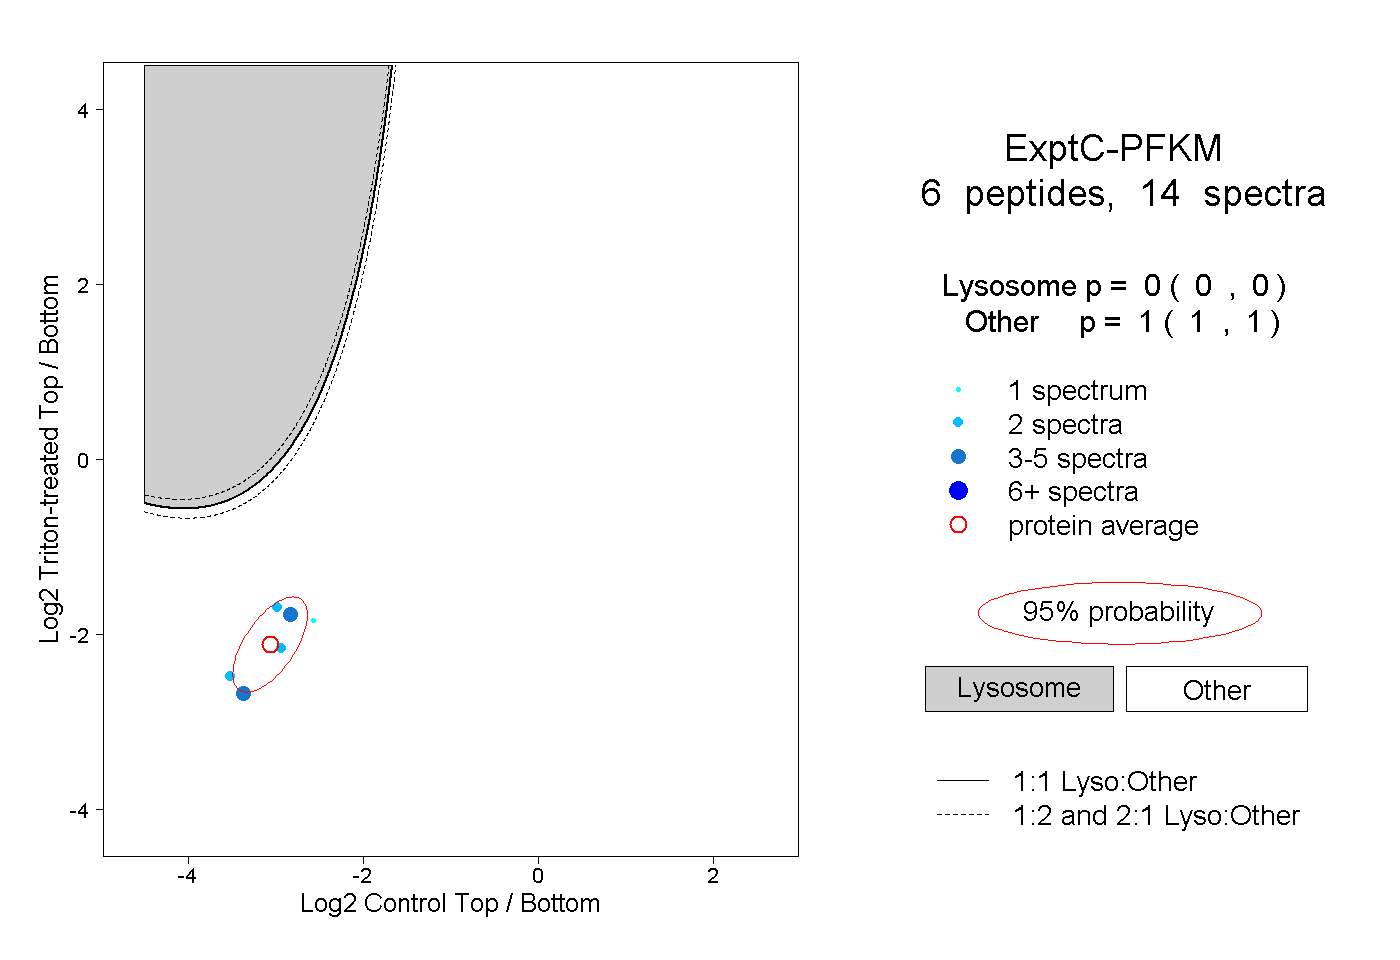
0.000 | 0.000
1.000 | 1.000
1peptide
spectrum
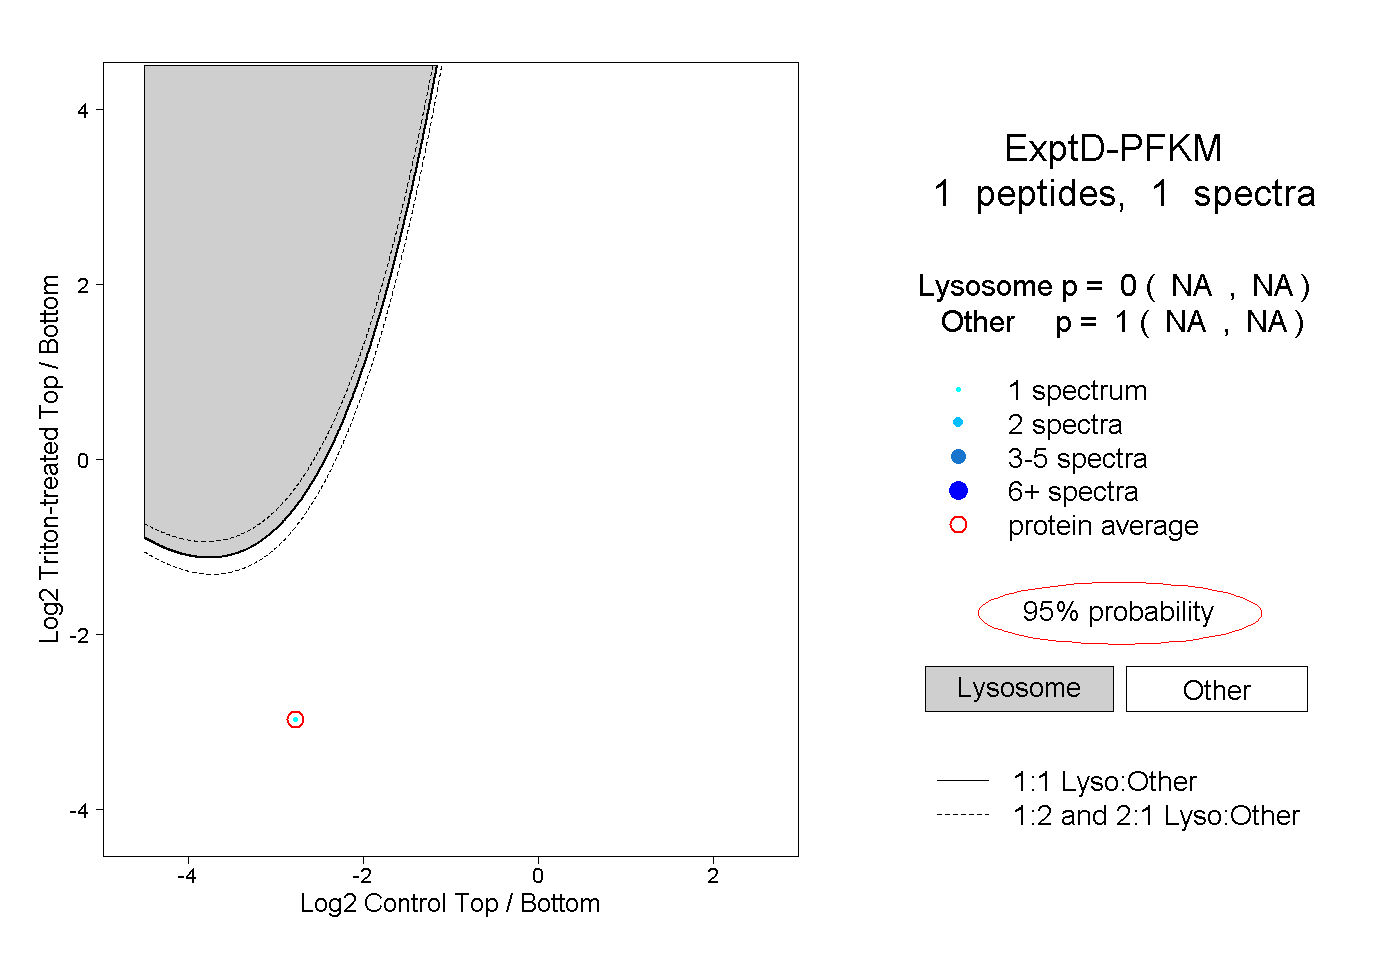
NA | NA
NA | NA