 5
5peptides
spectra
0.000 | 0.000
0.000 | 0.000
0.053 | 0.133
0.308 | 0.445
0.000 | 0.018
0.000 | 0.066
0.443 | 0.502
0.000 | 0.000
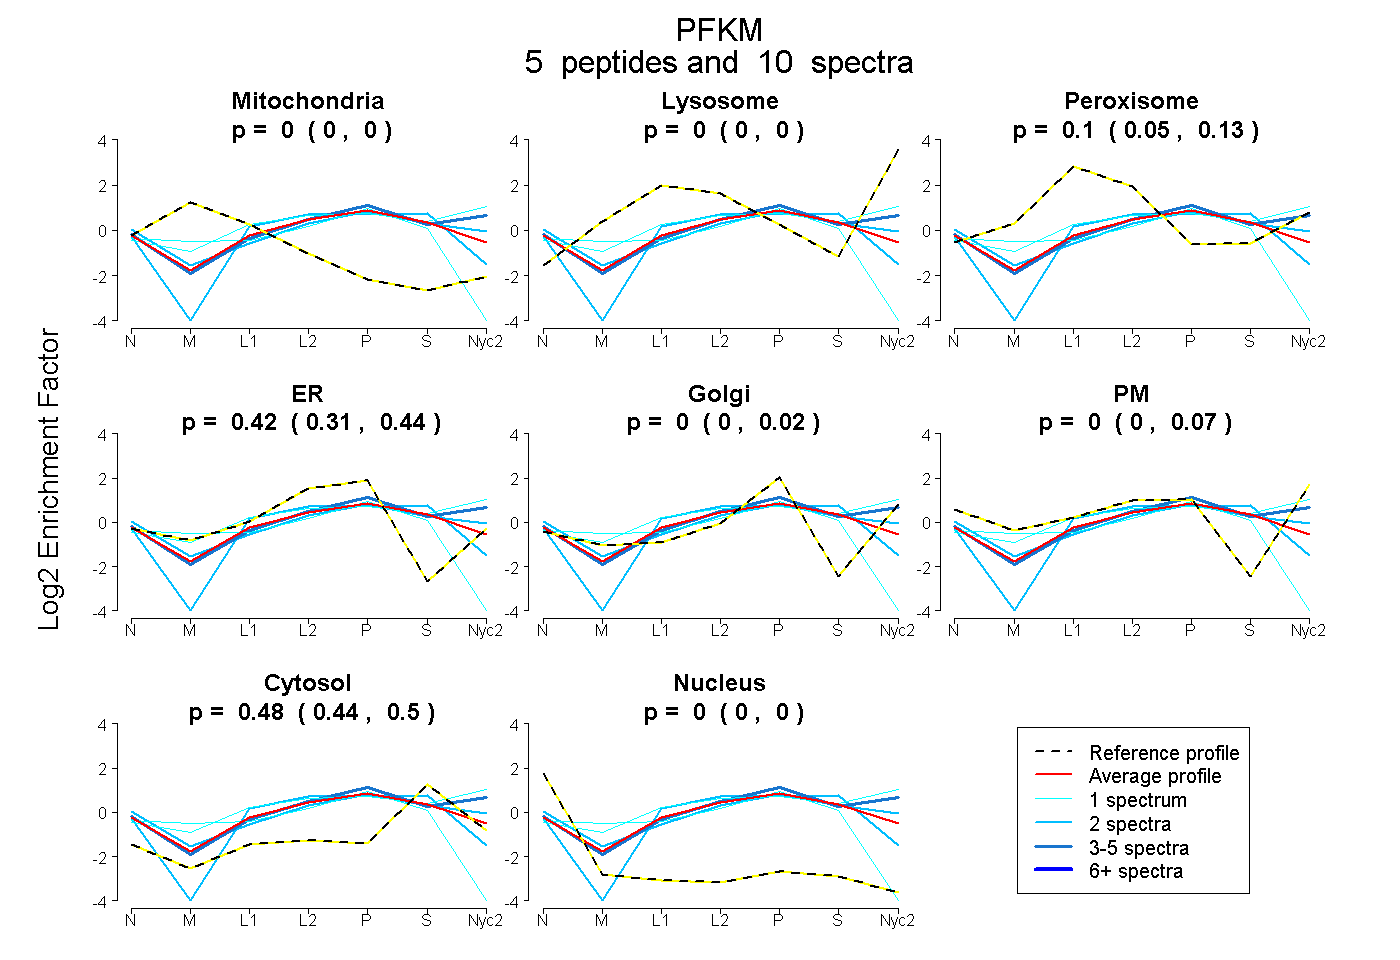
| Plot | Mito | Lyso | Perox | ER | Golgi | PM | Cytosol | Nucleus | |||||
| Expt A |
5 peptides |
10 spectra |
|
0.000 0.000 | 0.000 |
0.000 0.000 | 0.000 |
0.098 0.053 | 0.133 |
0.424 0.308 | 0.445 |
0.000 0.000 | 0.018 |
0.000 0.000 | 0.066 |
0.478 0.443 | 0.502 |
0.000 0.000 | 0.000 |
| 1 spectrum, SEWSDLLNDLQK | 0.204 | 0.000 | 0.000 | 0.386 | 0.000 | 0.000 | 0.342 | 0.068 | ||
| 1 spectrum, LNIIIVAEGAIDK | 0.000 | 0.208 | 0.190 | 0.000 | 0.187 | 0.085 | 0.331 | 0.000 | ||
| 2 spectra, DLQVNVEHLVQK | 0.000 | 0.000 | 0.000 | 0.372 | 0.000 | 0.000 | 0.628 | 0.000 | ||
| 2 spectra, DQTDFEHR | 0.000 | 0.000 | 0.026 | 0.266 | 0.000 | 0.229 | 0.479 | 0.000 | ||
| 4 spectra, LLAHVRPPVSK | 0.000 | 0.100 | 0.000 | 0.171 | 0.094 | 0.213 | 0.422 | 0.000 |
| Plot | Mito | Lyso or Perox | ER | Golgi | PM | Cytosol | Nucleus | ||||||
| Expt B |
3 peptides |
6 spectra |
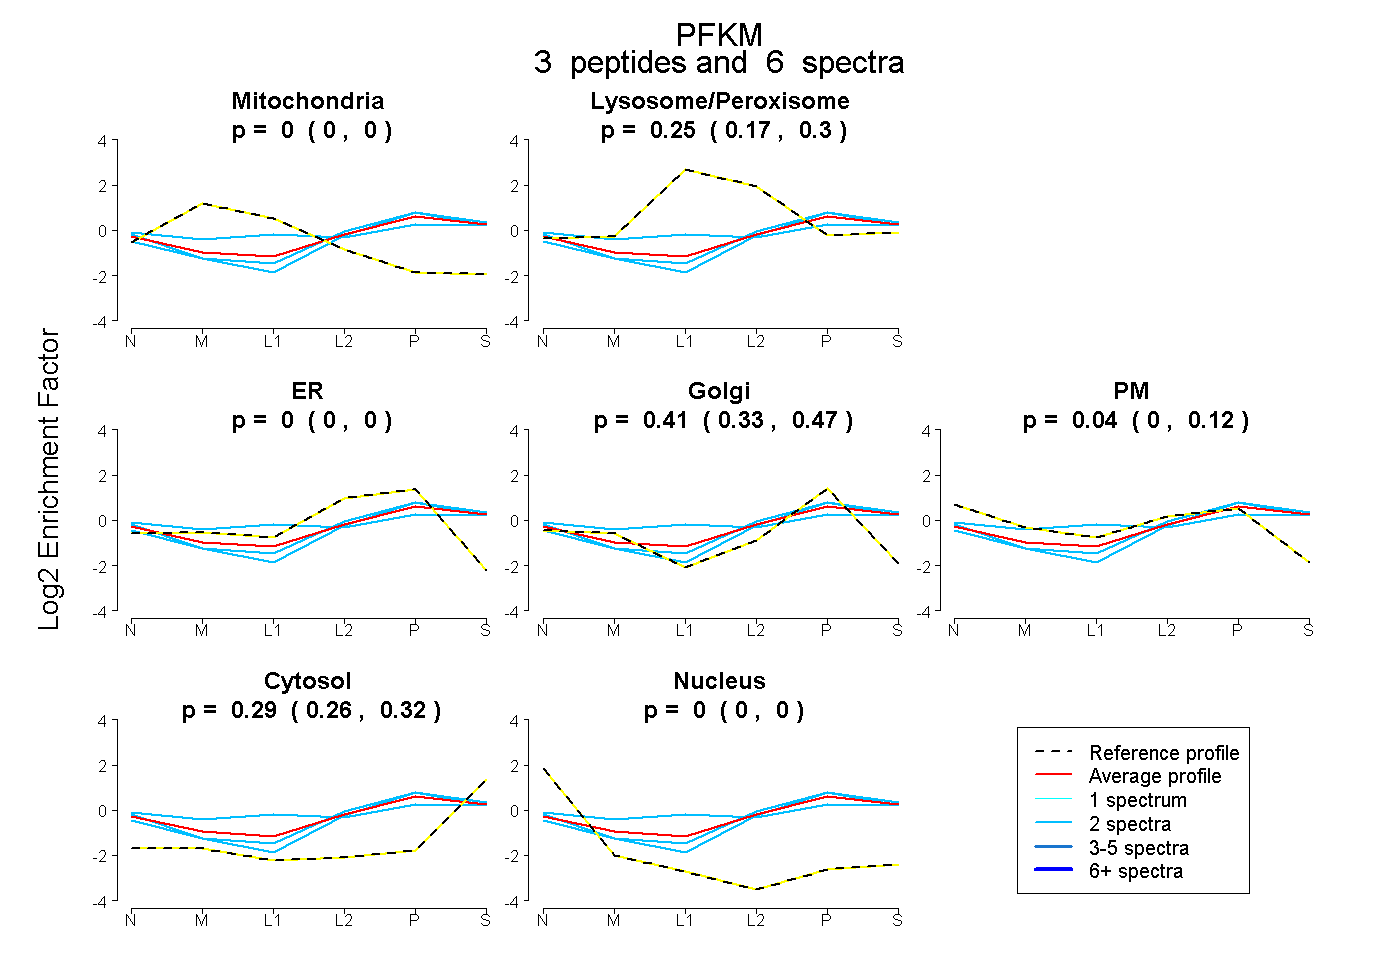 |
0.000 0.000 | 0.000 |
0.248 0.166 | 0.303 |
0.000 0.000 | 0.002 |
0.414 0.328 | 0.466 |
0.045 0.000 | 0.123 |
0.293 0.262 | 0.322 |
0.000 0.000 | 0.000 |
|||
| Plot | Lyso | Other | |||||||||||
| Expt C |
6 peptides |
14 spectra |
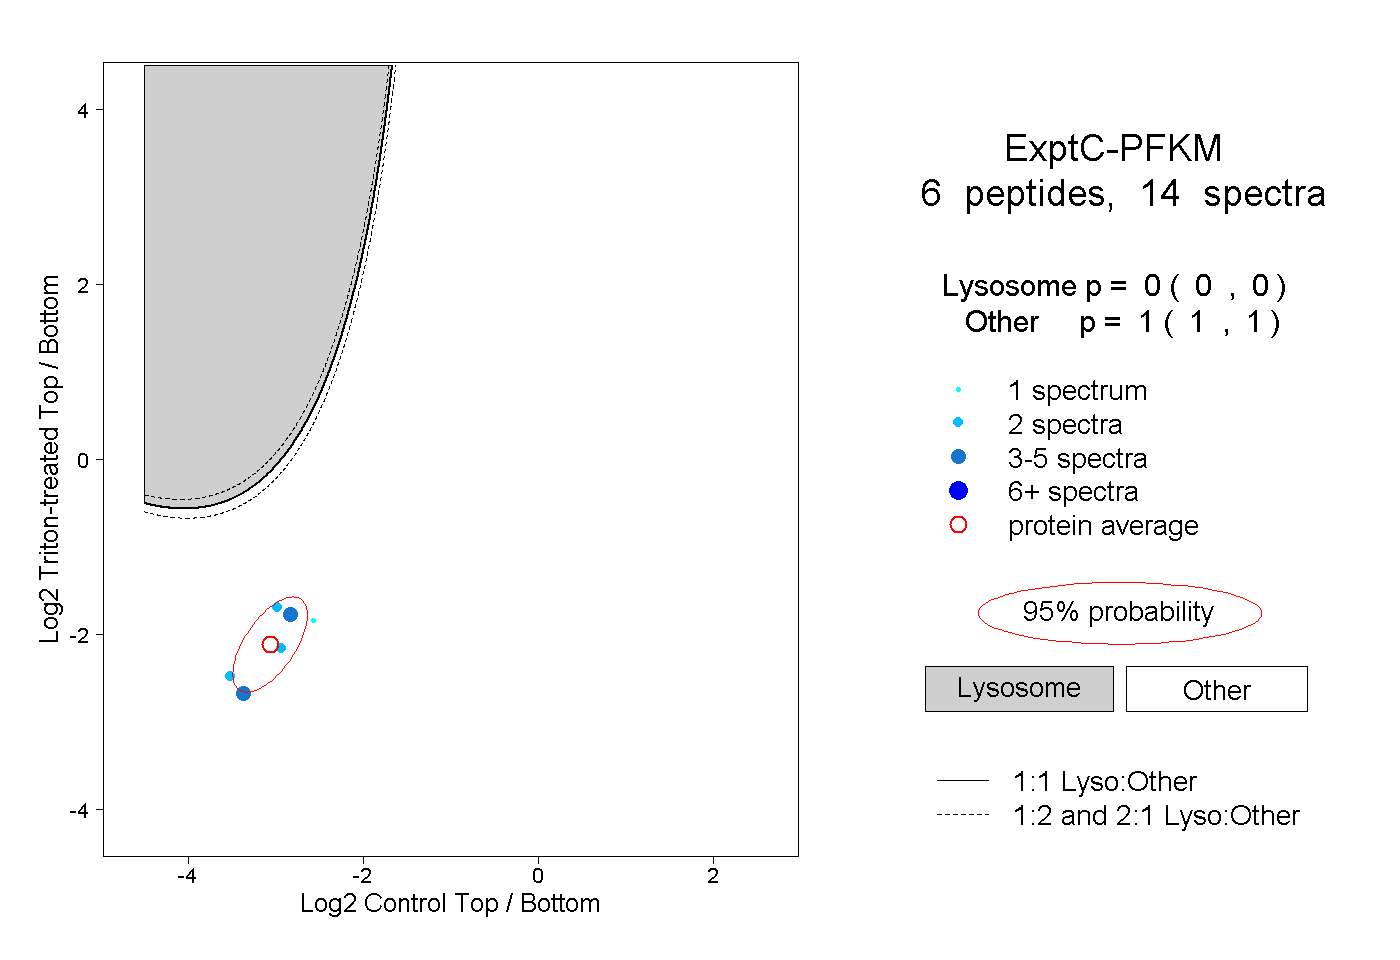 |
0.000 0.000 | 0.000 |
1.000 1.000 | 1.000 |
||||||||
| Plot | Lyso | Other | |||||||||||
| Expt D |
1 peptide |
1 spectrum |
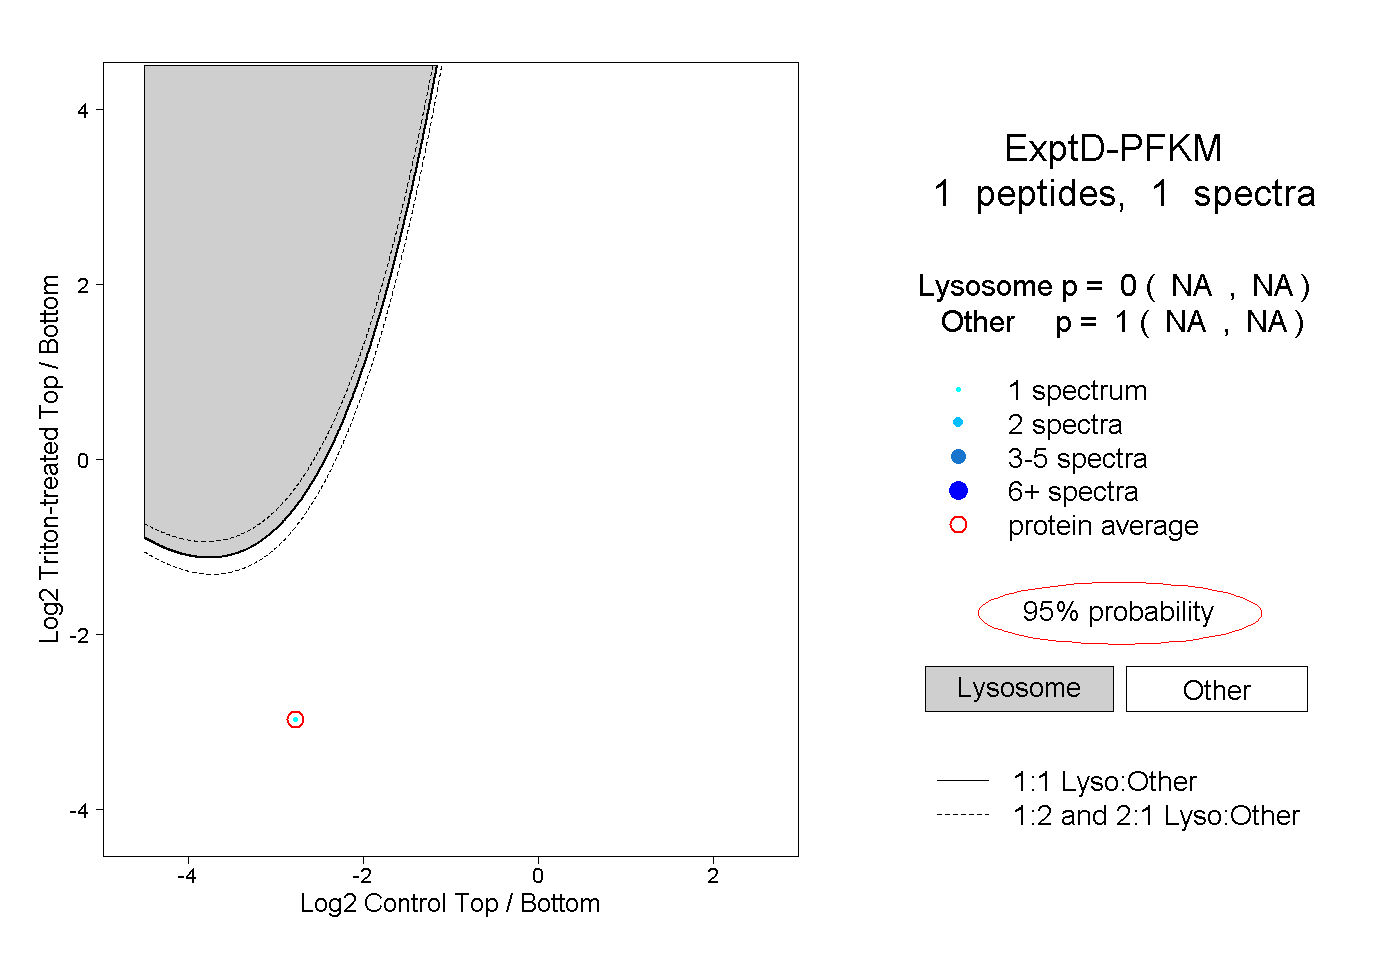 |
0.000 NA | NA |
1.000 NA | NA |