 12
12peptides
spectra
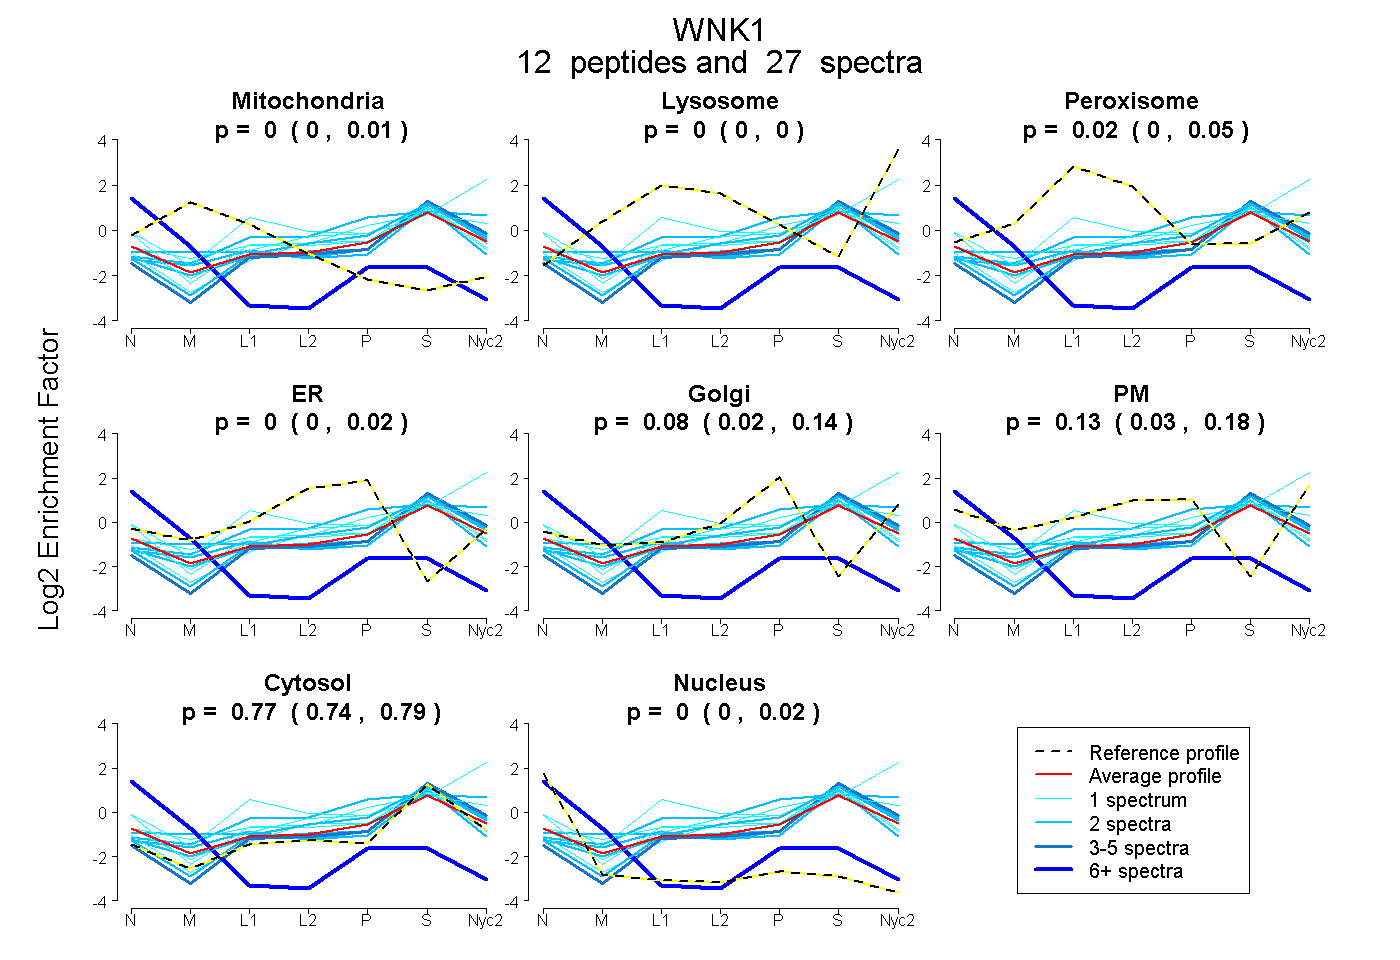
0.000 | 0.011
0.000 | 0.000
0.000 | 0.054
0.000 | 0.016
0.022 | 0.138
0.031 | 0.182
0.740 | 0.787
0.000 | 0.016
1peptide
spectrum
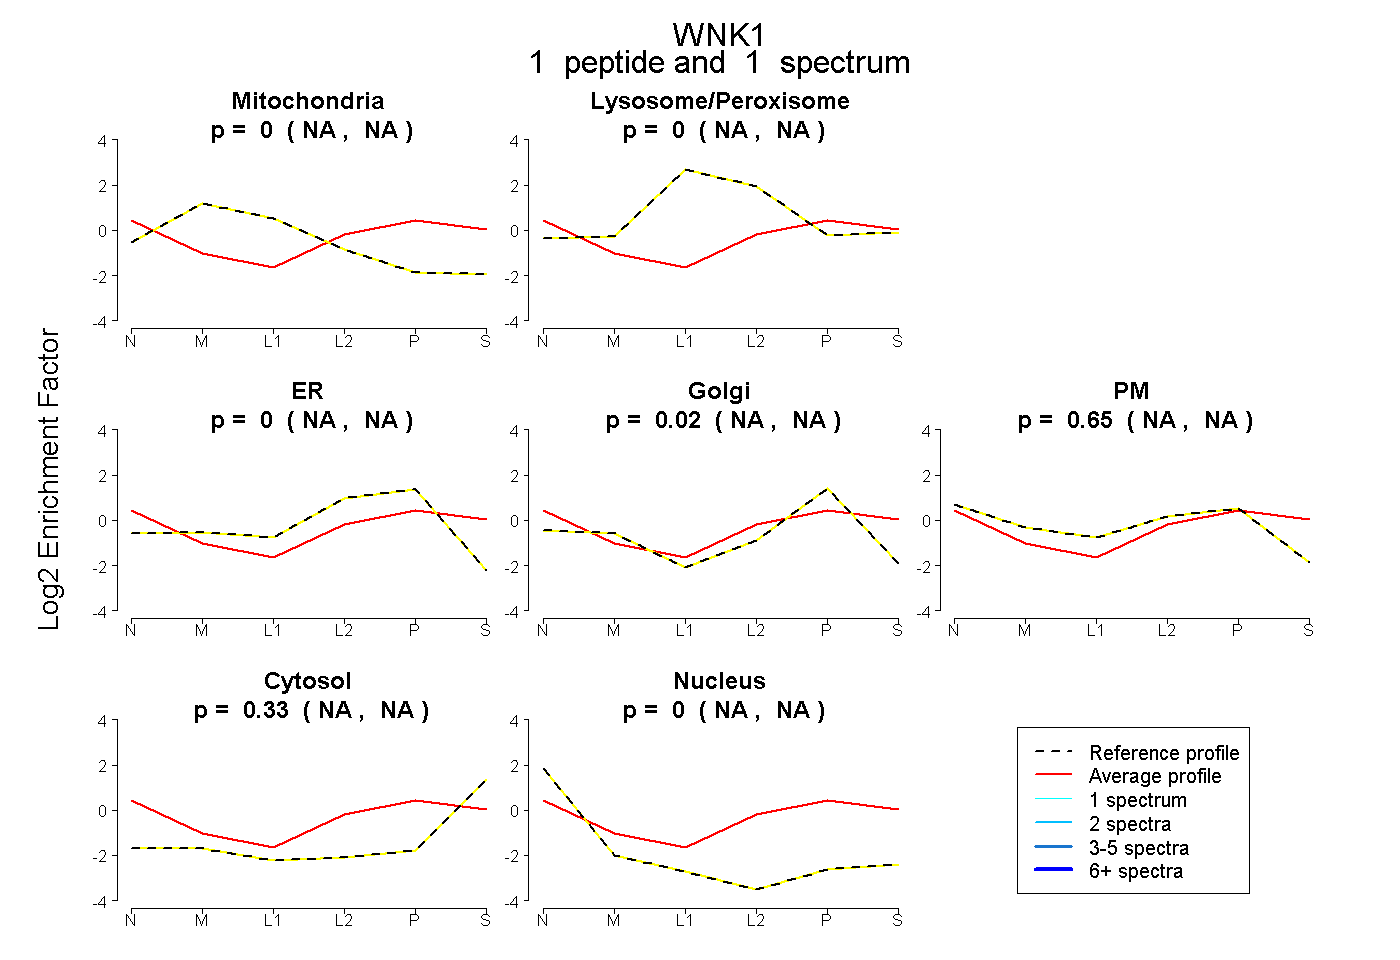
NA | NA
NA | NA
NA | NA
NA | NA
NA | NA
NA | NA
NA | NA
14peptides
spectra
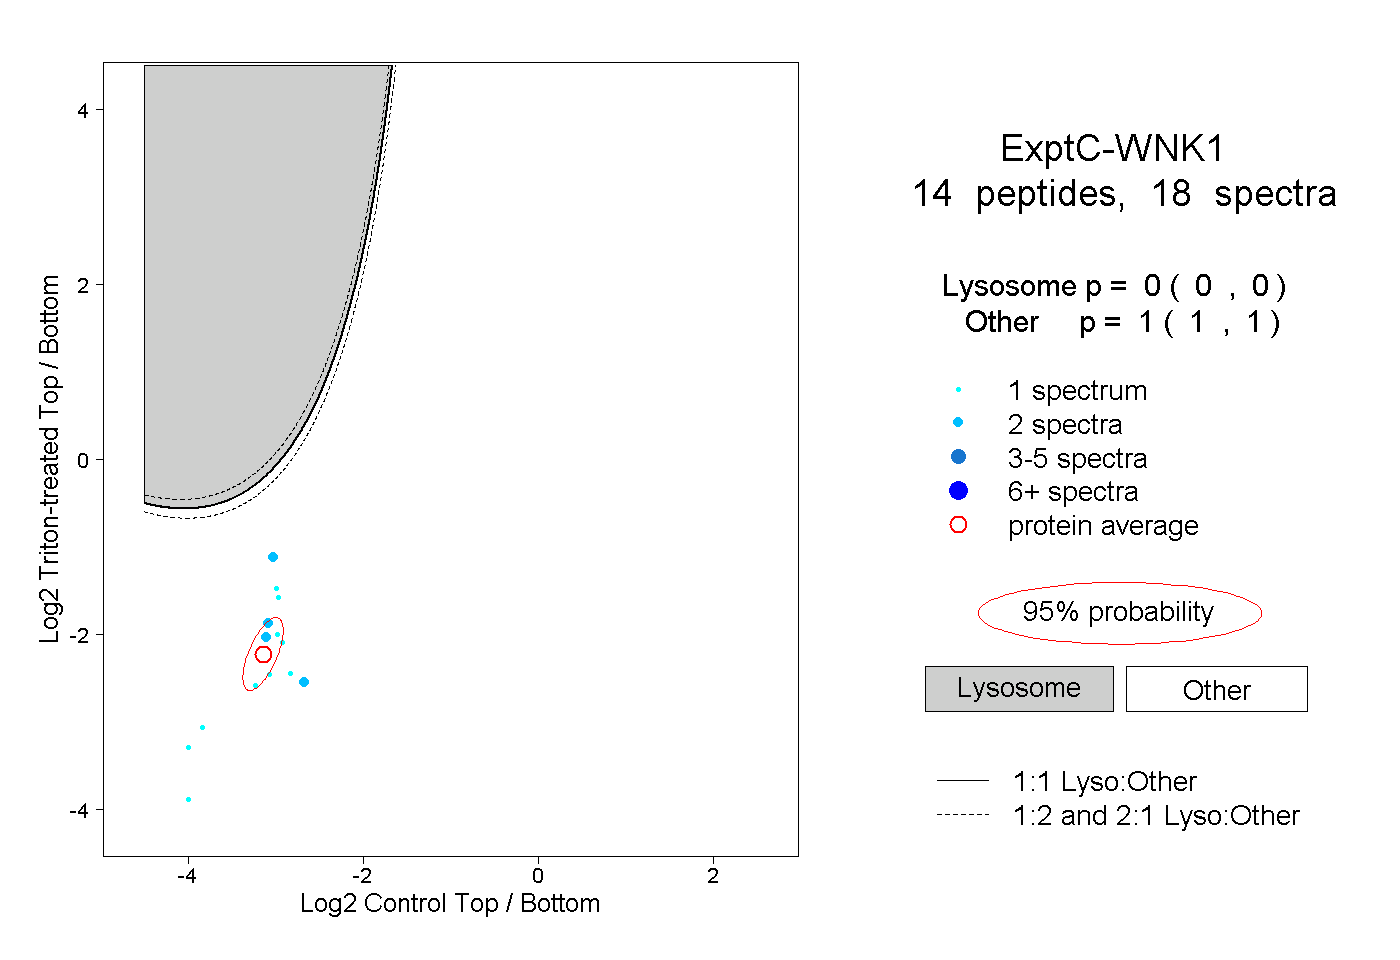
0.000 | 0.000
1.000 | 1.000