WNK1
[ENSRNOP00000013355]
Main page
| | | Plot |
Mito |
Lyso |
|
Perox |
ER |
Golgi |
PM |
Cytosol |
Nucleus |
|
| Expt A |
 12
12
peptides |
27
spectra |
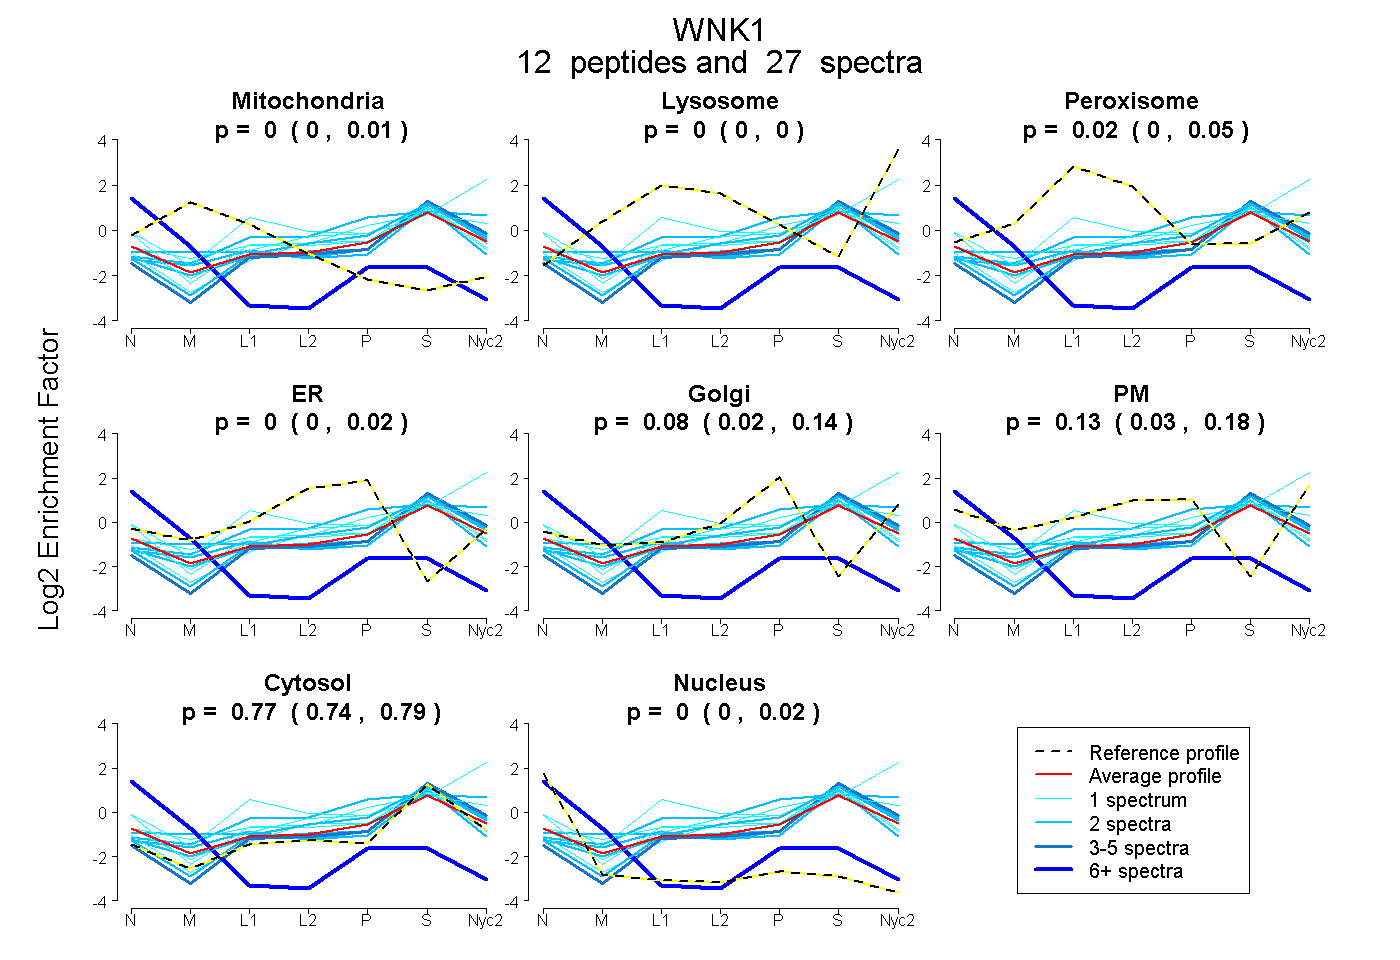 |
0.000
0.000 | 0.011 |
0.000
0.000 | 0.000 |
|
0.019
0.000 | 0.054 |
0.000
0.000 | 0.016 |
0.080
0.022 | 0.138 |
0.127
0.031 | 0.182 |
0.775
0.740 | 0.787 |
0.000
0.000 | 0.016 |
|
| | | Plot |
Mito |
|
Lyso or Perox |
|
ER |
Golgi |
PM |
Cytosol |
Nucleus |
|
| Expt B |
1
peptide |
1
spectrum |
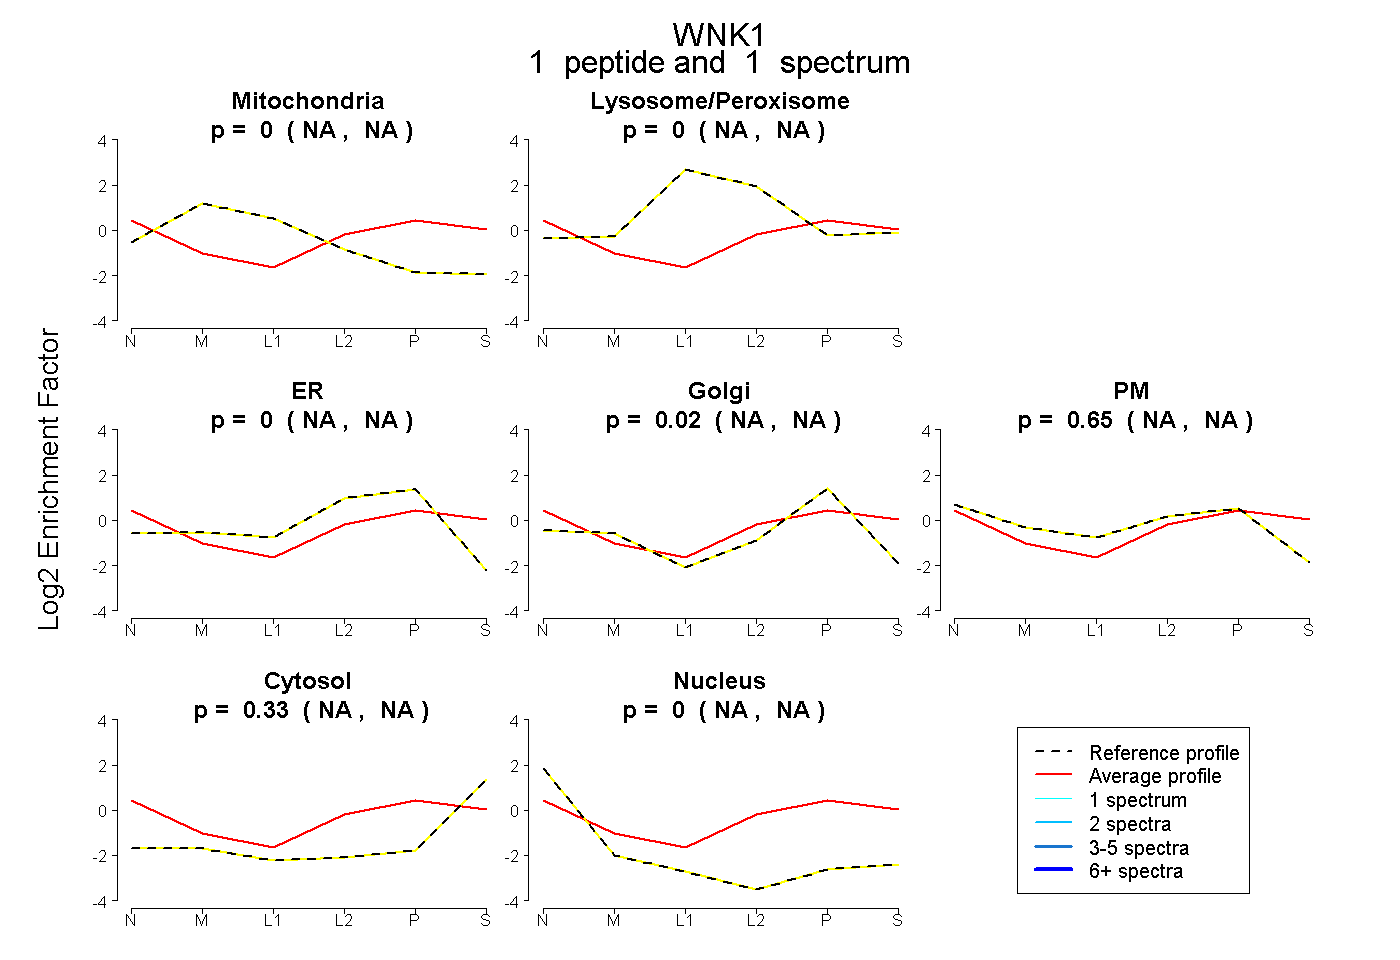 |
0.000
NA | NA |
|
0.000
NA | NA |
|
0.000
NA | NA |
0.021
NA | NA |
0.649
NA | NA |
0.330
NA | NA |
0.000
NA | NA |
|
| | | Plot |
|
Lyso |
|
|
|
|
|
|
|
Other |
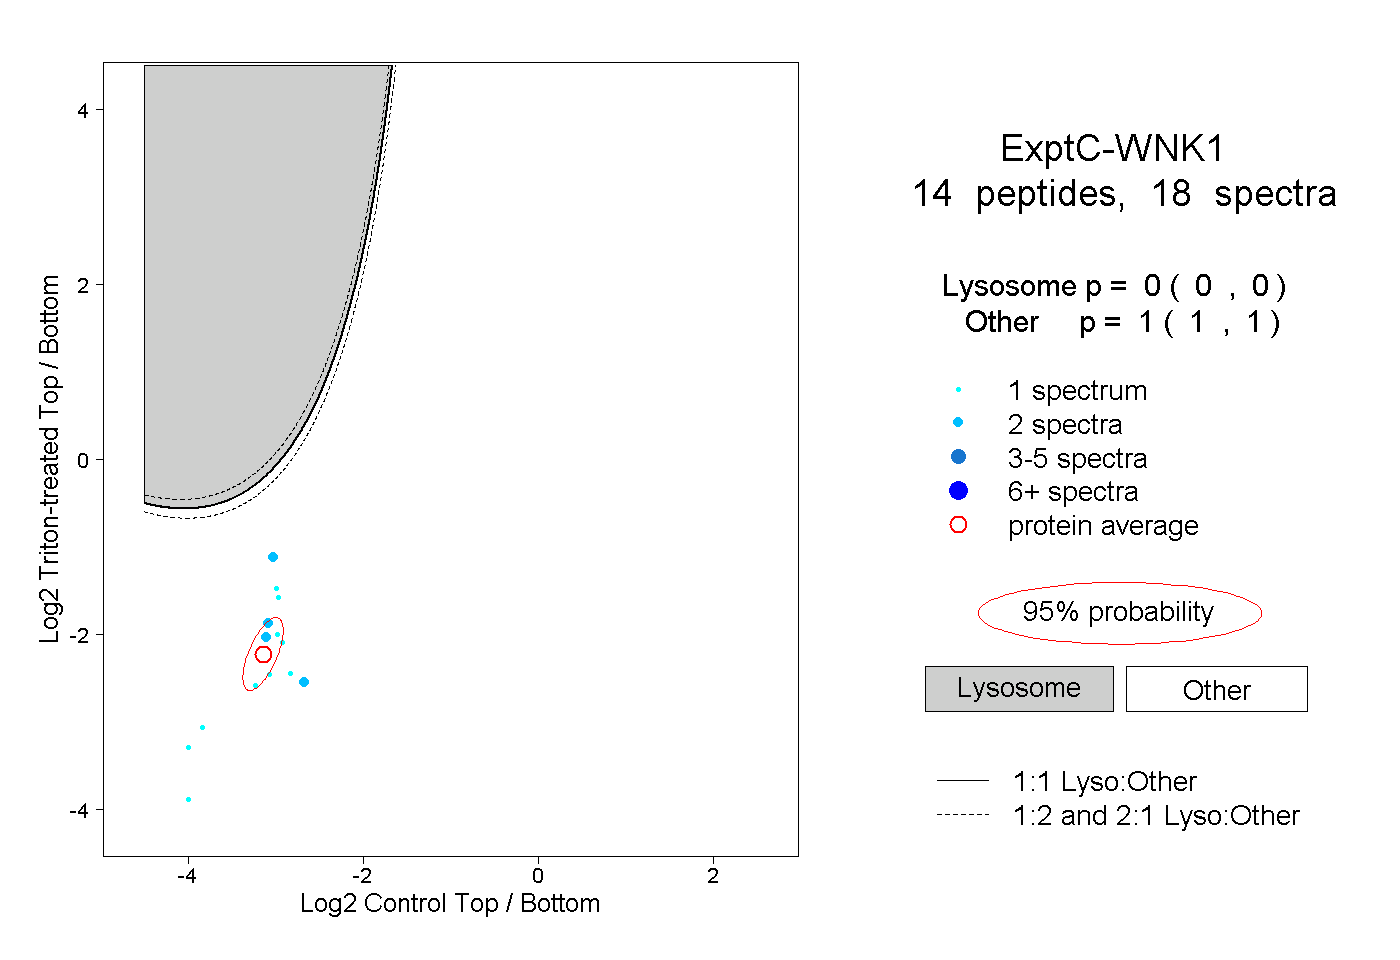
| Expt C |
14
peptides |
18
spectra |
 |
|
0.000
0.000 | 0.000 |
|
|
|
|
|
|
|
1.000
1.000 | 1.000 |
| 1 spectrum, QEESSFK |
|
0.000 |
|
|
|
|
|
|
|
1.000 |
| 2 spectra, GLQFLHTR |
|
0.000 |
|
|
|
|
|
|
|
1.000 |
| 1 spectrum, VTSGVKPASFDK |
|
0.000 |
|
|
|
|
|
|
|
1.000 |
| 1 spectrum, VSLLK |
|
0.000 |
|
|
|
|
|
|
|
1.000 |
| 2 spectra, SETGQPTK |
|
0.000 |
|
|
|
|
|
|
|
1.000 |
| 1 spectrum, GLQHPNIVR |
|
0.000 |
|
|
|
|
|
|
|
1.000 |
| 1 spectrum, TPPIIHR |
|
0.000 |
|
|
|
|
|
|
|
1.000 |
| 1 spectrum, VELAEEDDGEK |
|
0.000 |
|
|
|
|
|
|
|
1.000 |
| 1 spectrum, FIVSPVPESR |
|
0.000 |
|
|
|
|
|
|
|
1.000 |
| 1 spectrum, EIIEGCIR |
|
0.000 |
|
|
|
|
|
|
|
1.000 |
| 2 spectra, SGSGSGGASAK |
|
0.000 |
|
|
|
|
|
|
|
1.000 |
| 1 spectrum, TPTPEAK |
|
0.000 |
|
|
|
|
|
|
|
1.000 |
| 1 spectrum, EIQDLQSR |
|
0.000 |
|
|
|
|
|
|
|
1.000 |
| 2 spectra, FDIELGR |
|
0.000 |
|
|
|
|
|
|
|
1.000 |