 11
11peptides
spectra
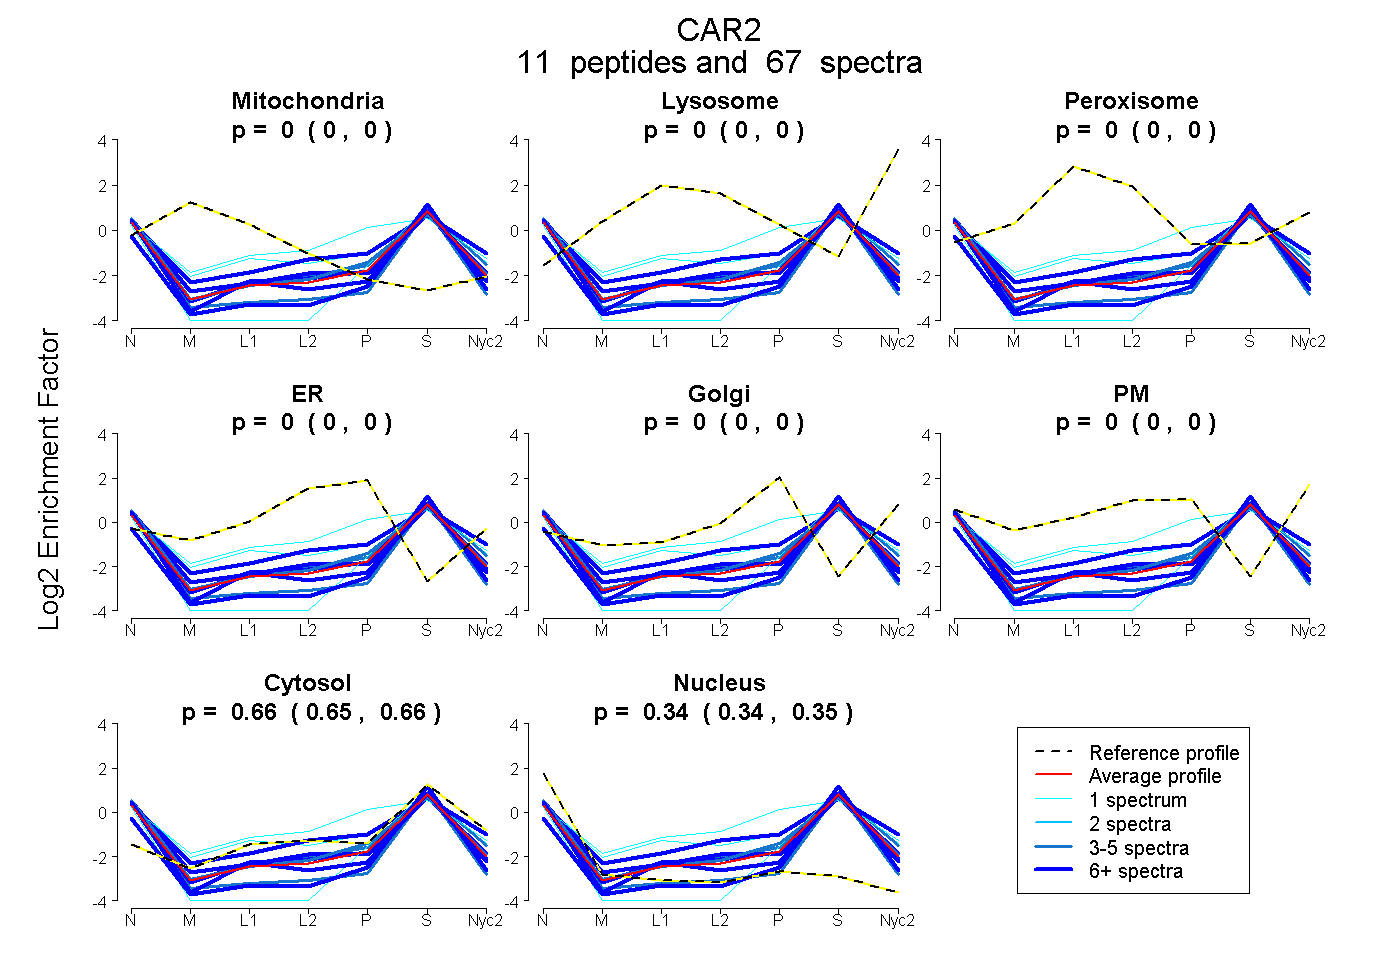
0.000 | 0.000
0.000 | 0.000
0.000 | 0.000
0.000 | 0.000
0.000 | 0.000
0.000 | 0.000
0.650 | 0.660
0.339 | 0.348
8peptides
spectra
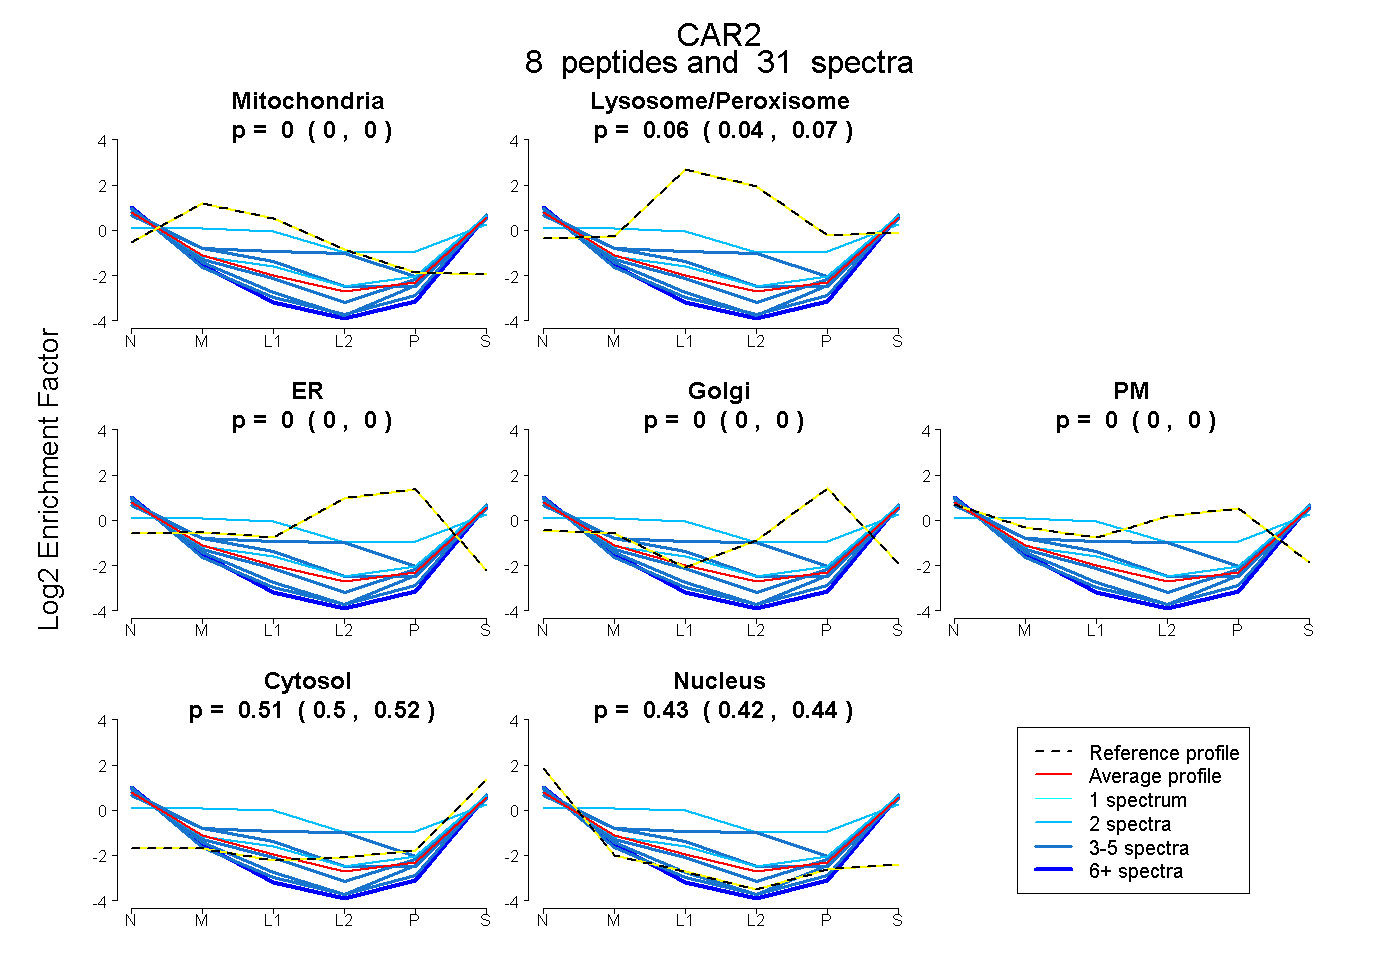
0.000 | 0.001
0.041 | 0.075
0.000 | 0.000
0.000 | 0.000
0.000 | 0.000
0.495 | 0.520
0.422 | 0.440
9peptides
spectra
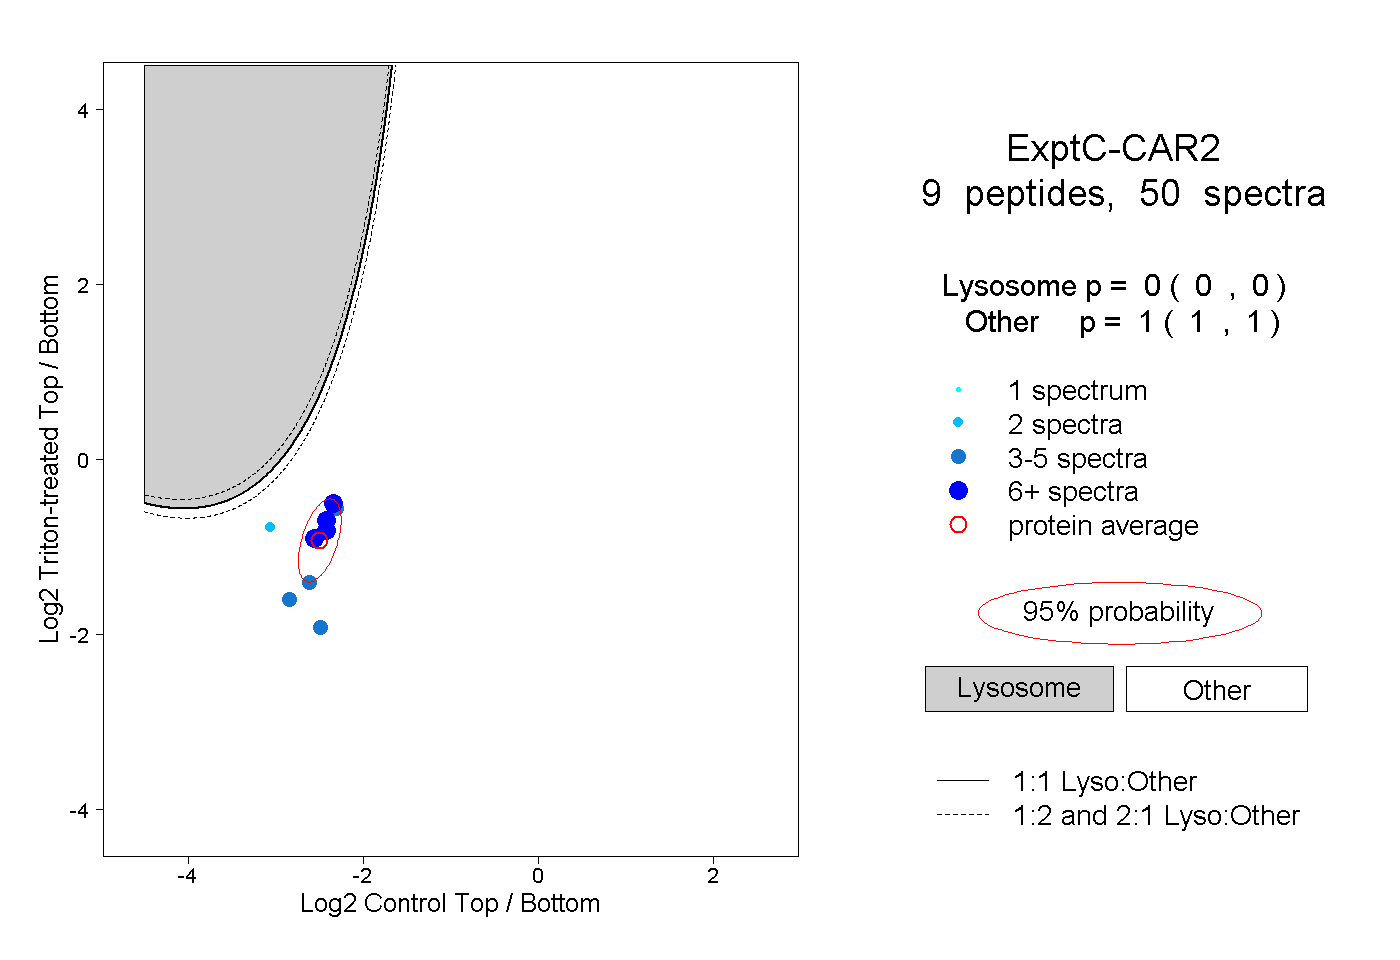
0.000 | 0.000
1.000 | 1.000
4peptides
spectra
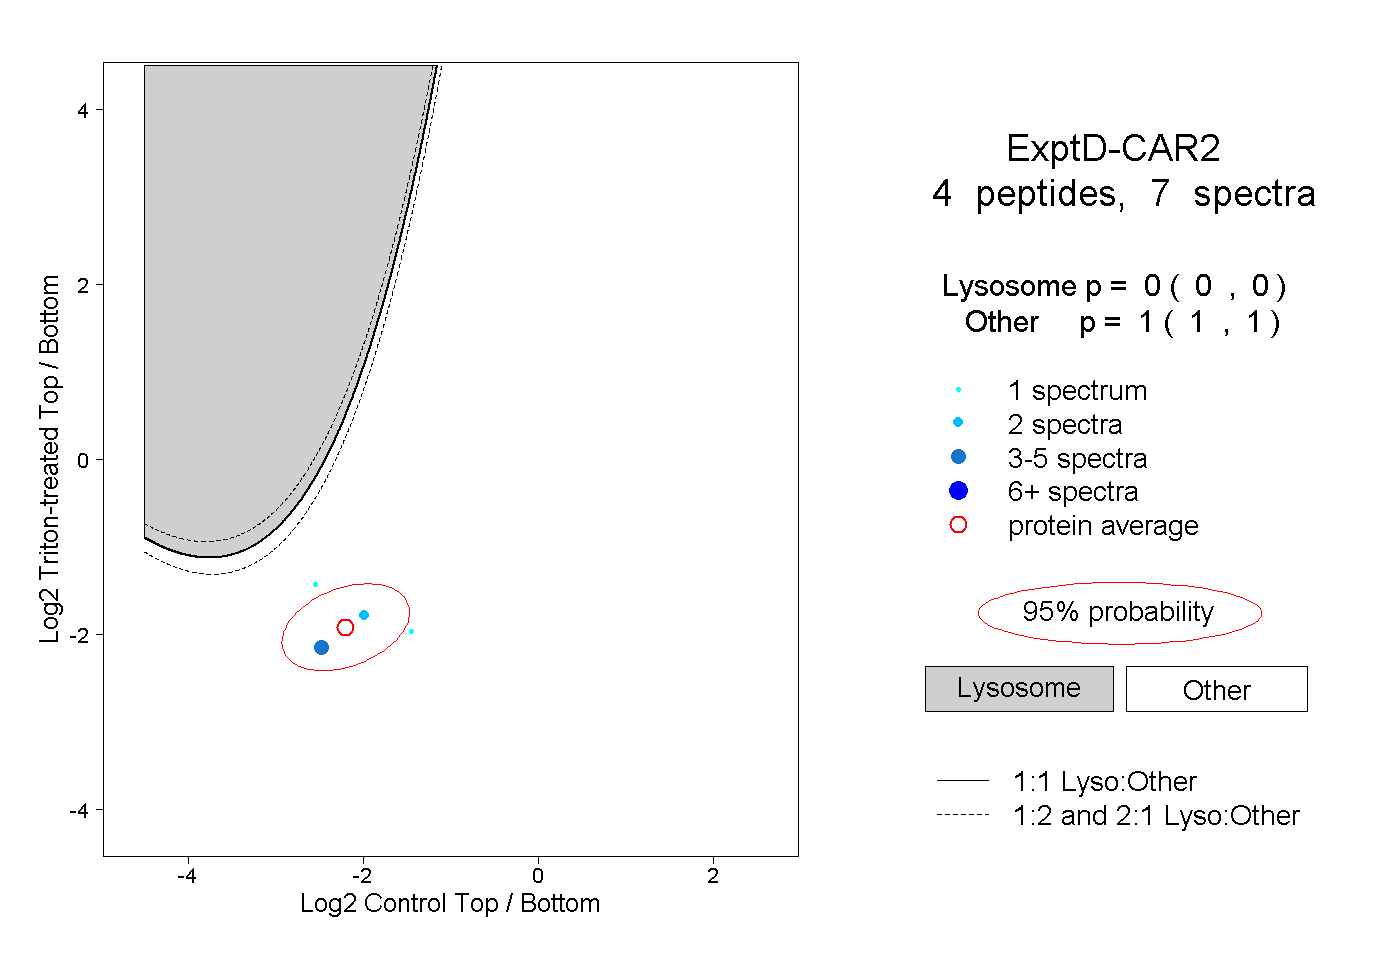
0.000 | 0.000
1.000 | 1.000