 11
11peptides
spectra
0.000 | 0.000
0.000 | 0.000
0.000 | 0.000
0.000 | 0.000
0.000 | 0.000
0.000 | 0.000
0.650 | 0.660
0.339 | 0.348
| Plot | Mito | Lyso | Perox | ER | Golgi | PM | Cytosol | Nucleus | |||||
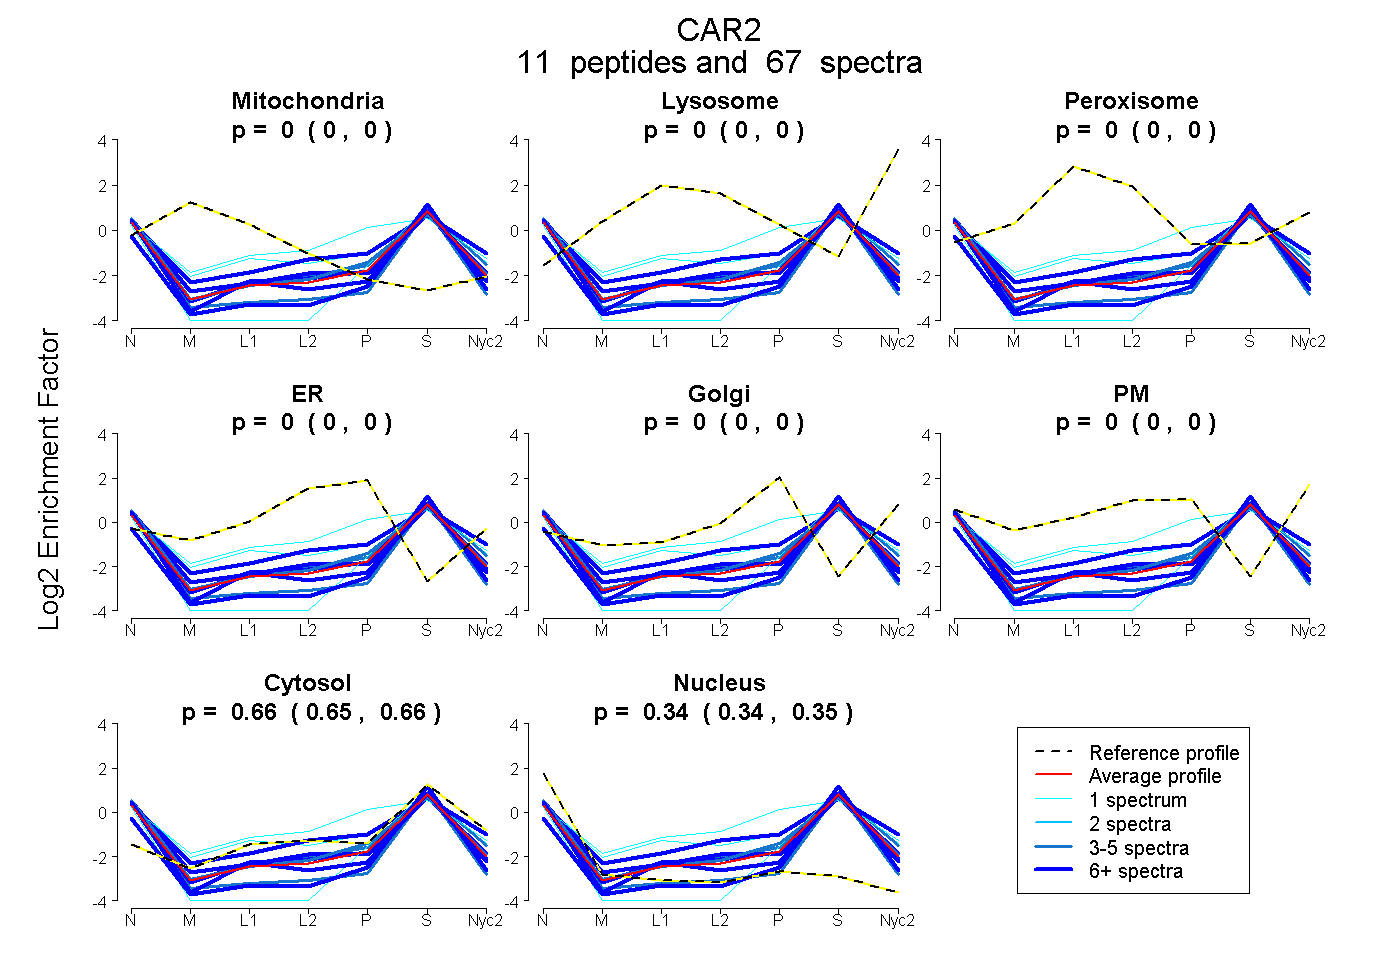
| Expt A |
11 peptides |
67 spectra |
|
0.000 0.000 | 0.000 |
0.000 0.000 | 0.000 |
0.000 0.000 | 0.000 |
0.000 0.000 | 0.000 |
0.000 0.000 | 0.000 |
0.000 0.000 | 0.000 |
0.656 0.650 | 0.660 |
0.344 0.339 | 0.348 |
| 5 spectra, EGPLSGSYR | 0.000 | 0.000 | 0.000 | 0.000 | 0.000 | 0.000 | 0.706 | 0.294 | ||
| 1 spectrum, SHHWGYSK | 0.000 | 0.000 | 0.000 | 0.266 | 0.005 | 0.015 | 0.608 | 0.106 | ||
| 3 spectra, SNGPENWHK | 0.000 | 0.000 | 0.000 | 0.000 | 0.000 | 0.000 | 0.648 | 0.352 | ||
| 1 spectrum, EFPIANGDR | 0.000 | 0.000 | 0.088 | 0.000 | 0.000 | 0.051 | 0.630 | 0.231 | ||
| 12 spectra, YAAELHLVHWNTK | 0.000 | 0.000 | 0.000 | 0.000 | 0.000 | 0.000 | 0.589 | 0.411 | ||
| 5 spectra, AVQHPDGLAVLGIFLK | 0.000 | 0.000 | 0.000 | 0.000 | 0.000 | 0.000 | 0.512 | 0.488 | ||
| 13 spectra, EPITVSSEQMSHFR | 0.000 | 0.000 | 0.000 | 0.000 | 0.000 | 0.128 | 0.675 | 0.197 | ||
| 11 spectra, ITEALHSIK | 0.000 | 0.000 | 0.000 | 0.000 | 0.000 | 0.000 | 0.642 | 0.358 | ||
| 1 spectrum, LNFNSEGEAEELMVDNWRPAQPLK | 0.000 | 0.000 | 0.000 | 0.000 | 0.000 | 0.000 | 0.515 | 0.485 | ||
| 8 spectra, YGDFGK | 0.000 | 0.000 | 0.000 | 0.000 | 0.000 | 0.000 | 0.618 | 0.382 | ||
| 7 spectra, IGPASQGLQK | 0.000 | 0.000 | 0.000 | 0.000 | 0.000 | 0.000 | 0.660 | 0.340 |
| Plot | Mito | Lyso or Perox | ER | Golgi | PM | Cytosol | Nucleus | ||||||
| Expt B |
8 peptides |
31 spectra |
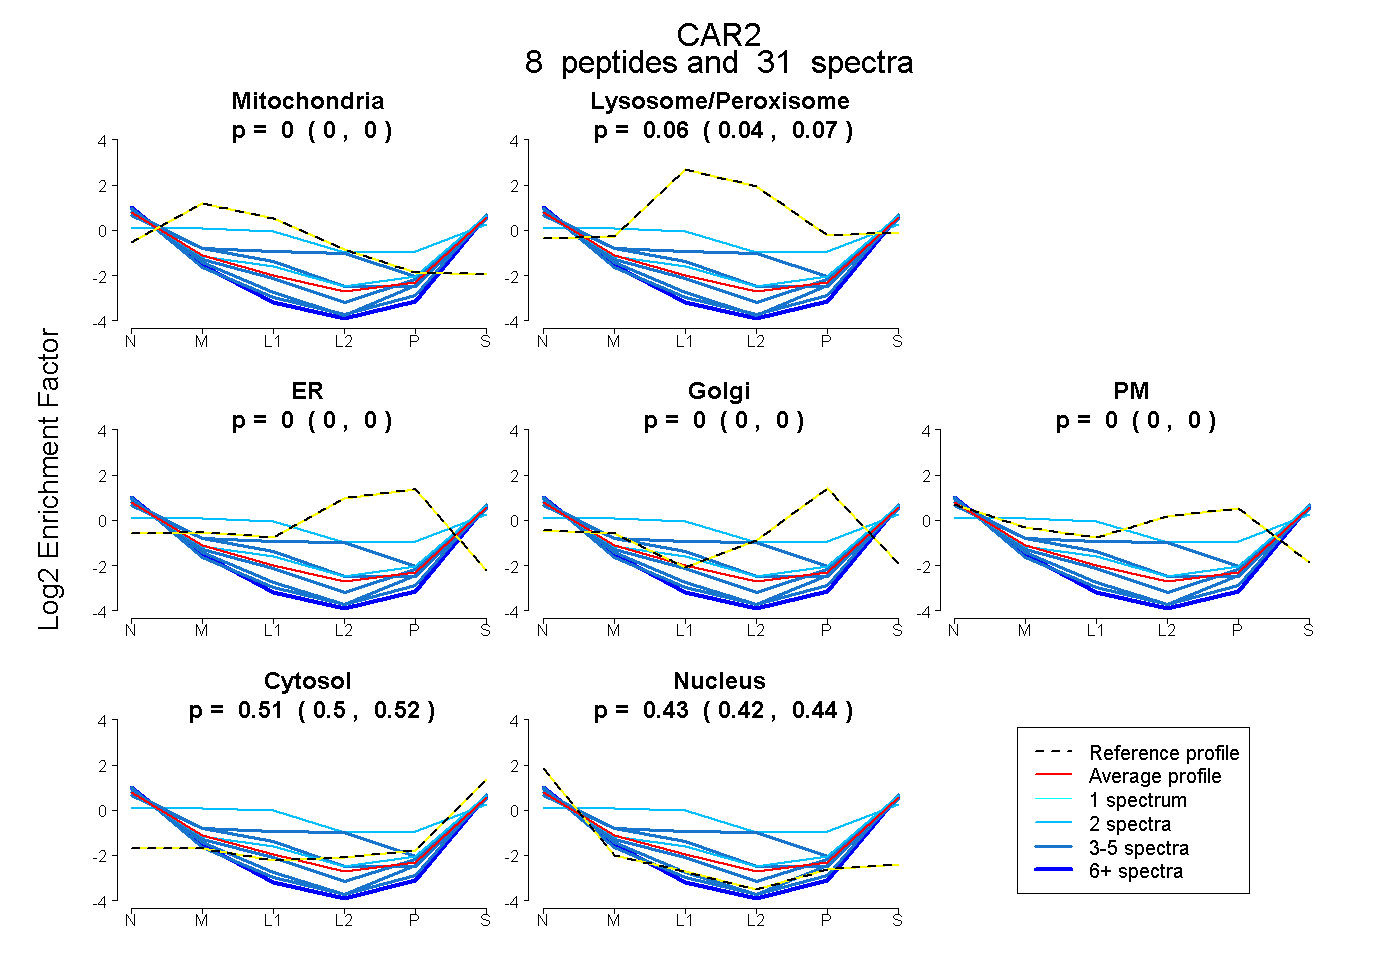 |
0.000 0.000 | 0.001 |
0.059 0.041 | 0.075 |
0.000 0.000 | 0.000 |
0.000 0.000 | 0.000 |
0.000 0.000 | 0.000 |
0.509 0.495 | 0.520 |
0.433 0.422 | 0.440 |
|||
| Plot | Lyso | Other | |||||||||||
| Expt C |
9 peptides |
50 spectra |
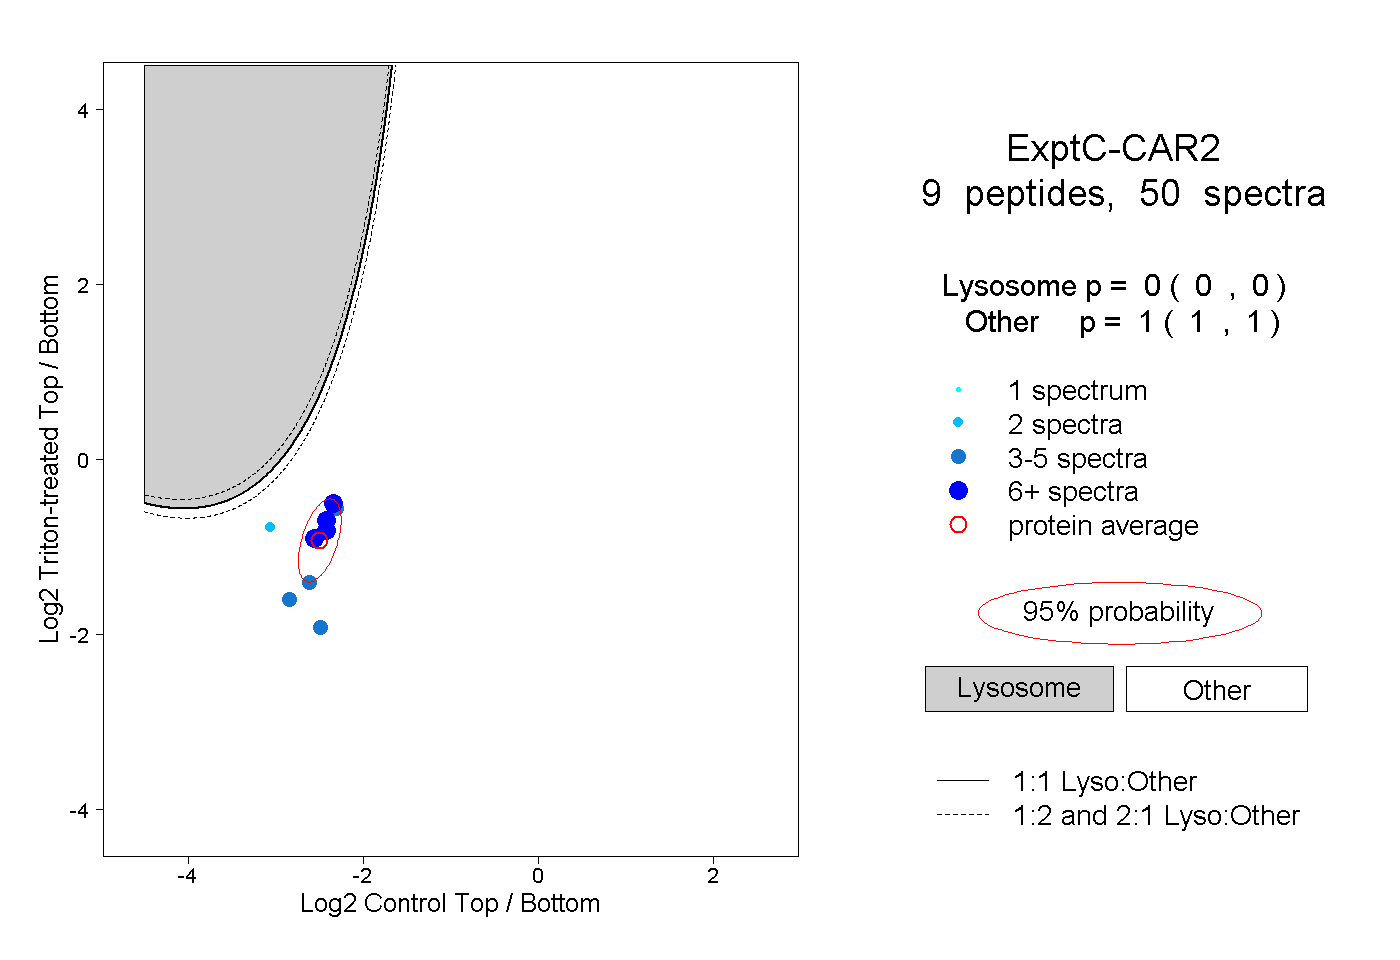 |
0.000 0.000 | 0.000 |
1.000 1.000 | 1.000 |
||||||||
| Plot | Lyso | Other | |||||||||||
| Expt D |
4 peptides |
7 spectra |
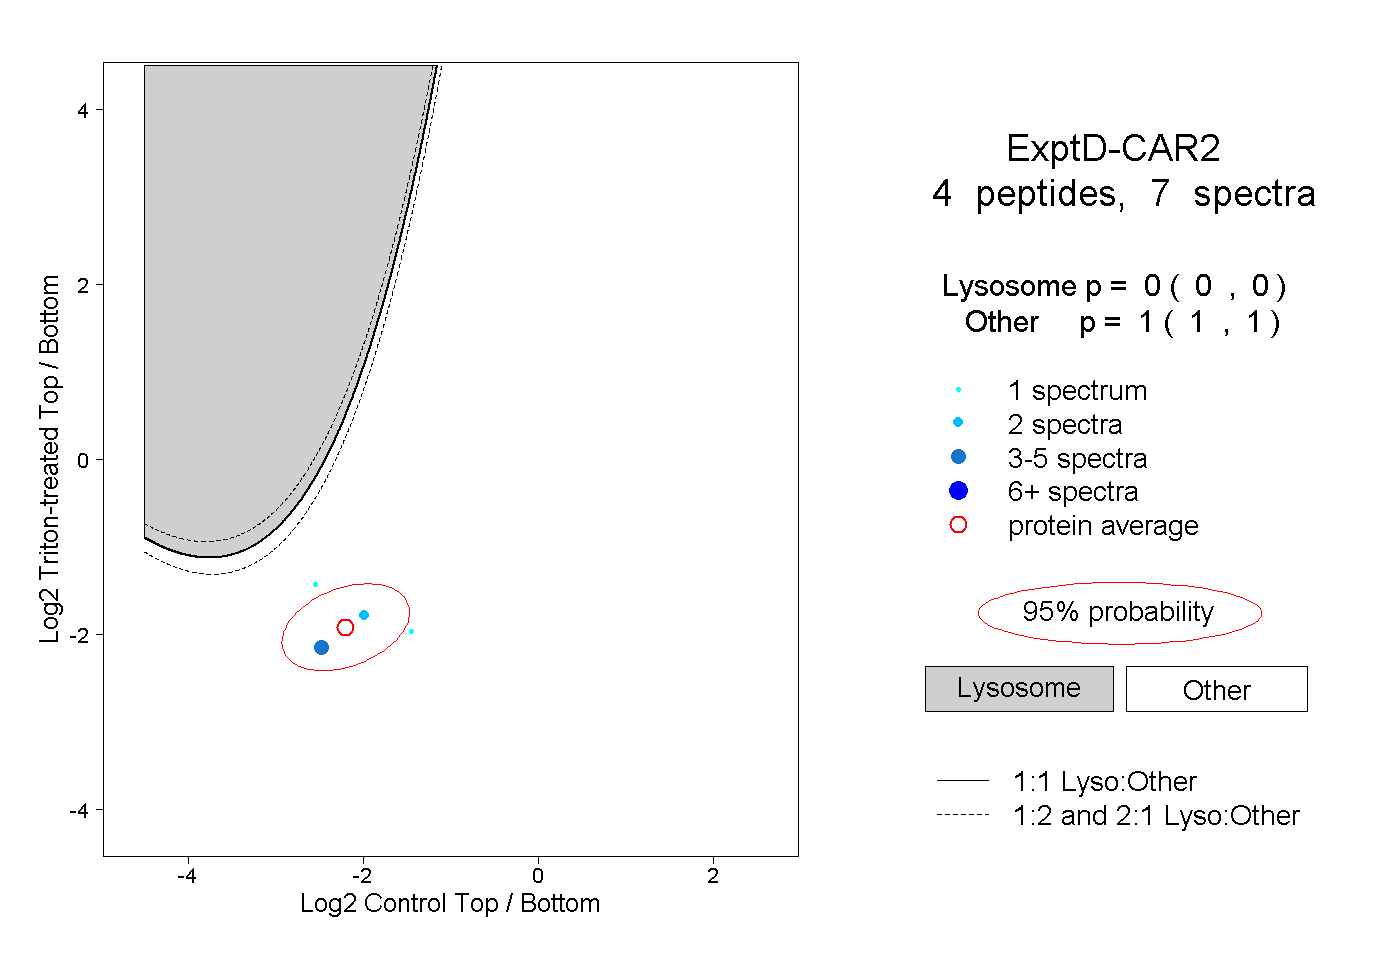 |
0.000 0.000 | 0.000 |
1.000 1.000 | 1.000 |