 13
13peptides
spectra
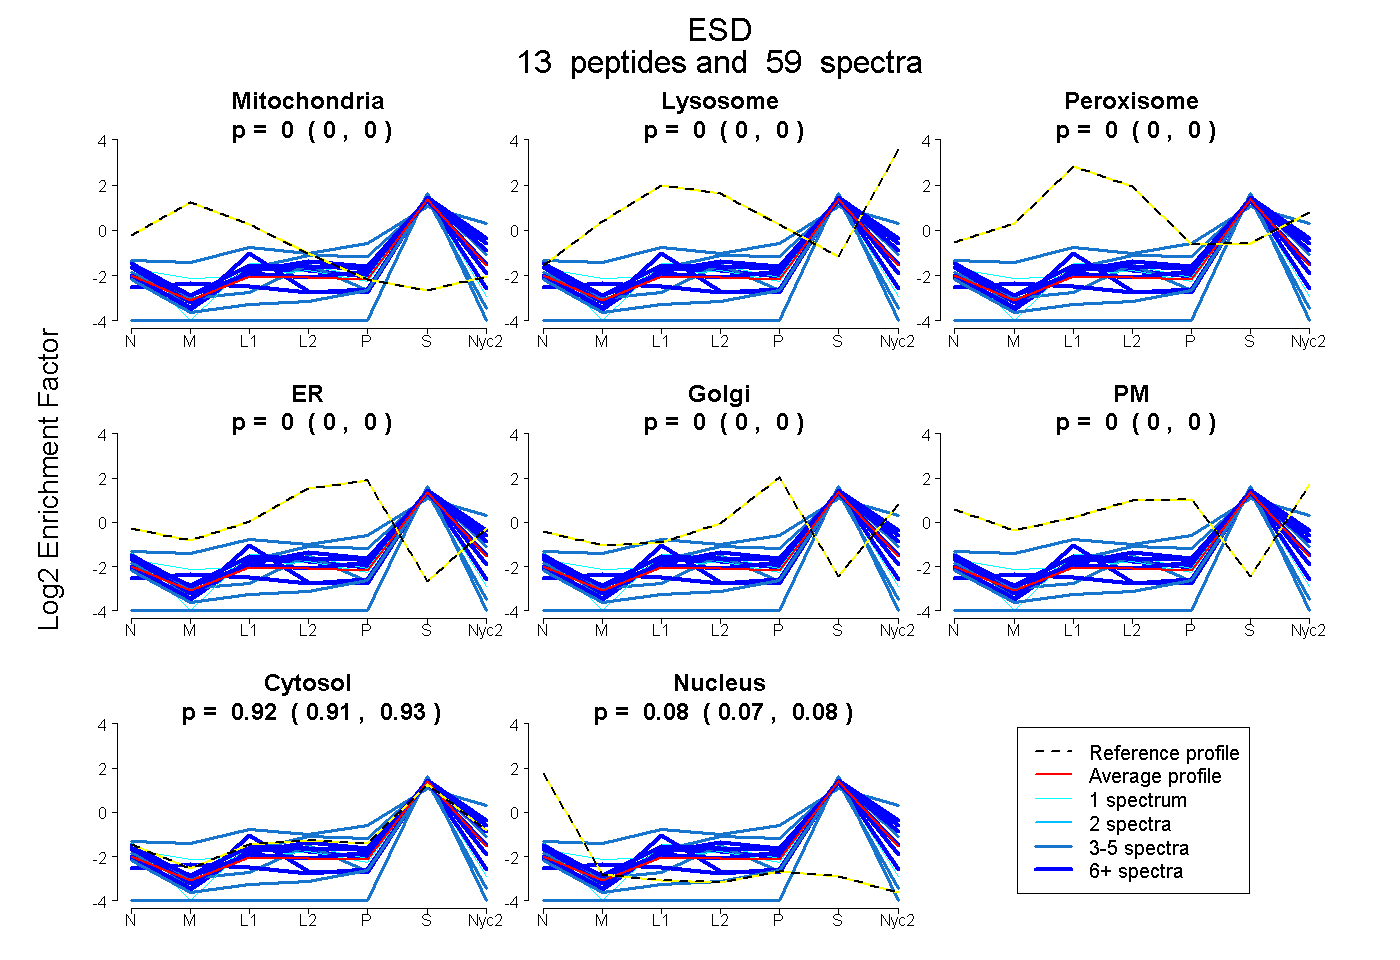
0.000 | 0.000
0.000 | 0.000
0.000 | 0.000
0.000 | 0.000
0.000 | 0.000
0.000 | 0.000
0.914 | 0.930
0.069 | 0.084
6peptides
spectra
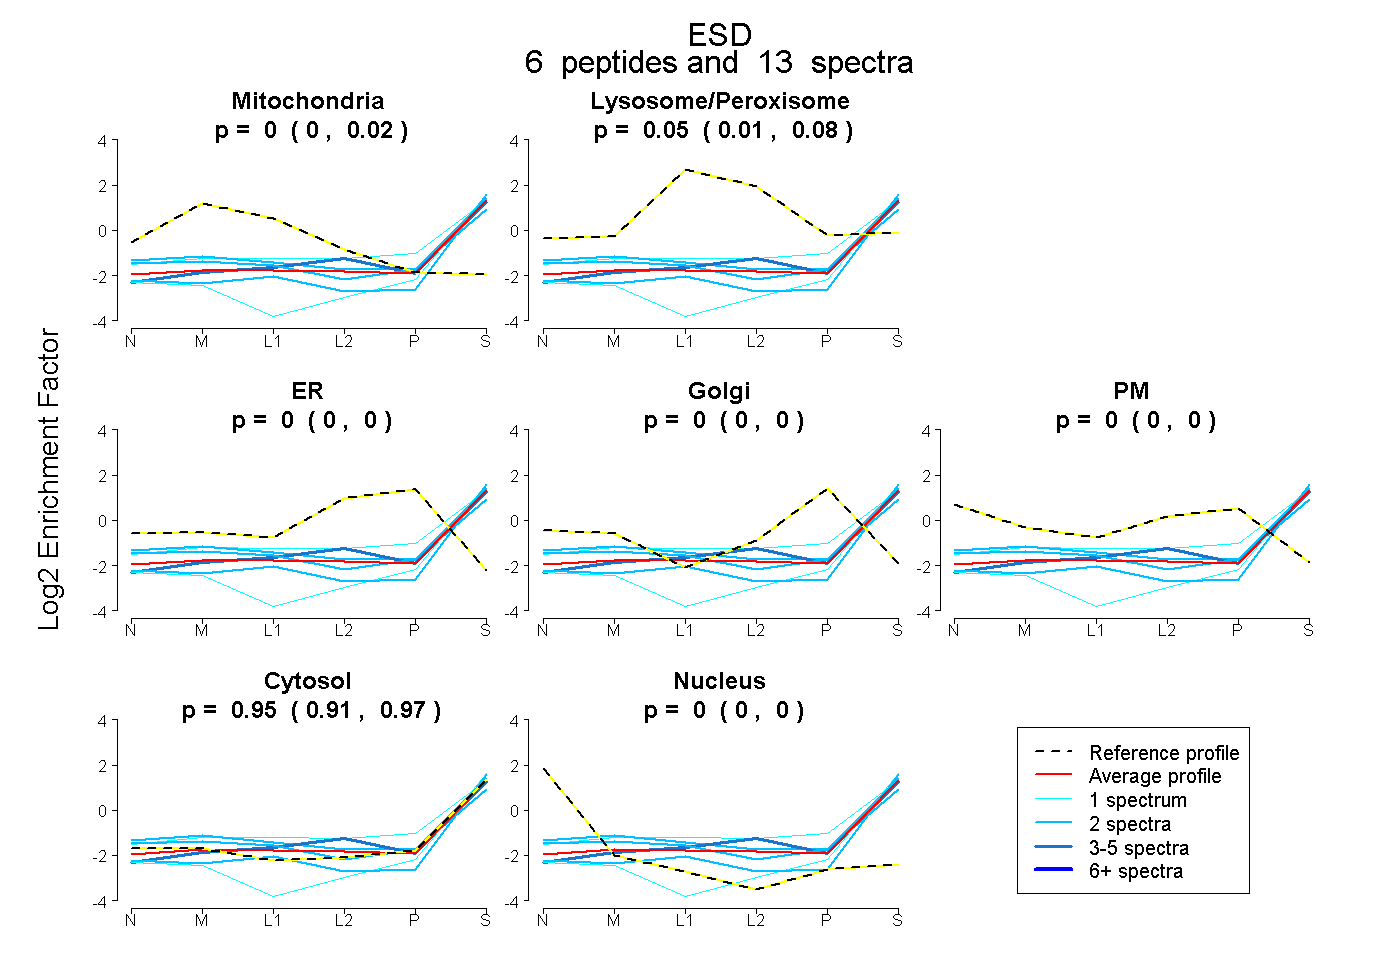
0.000 | 0.020
0.014 | 0.082
0.000 | 0.000
0.000 | 0.000
0.000 | 0.000
0.913 | 0.971
0.000 | 0.000
8peptides
spectra
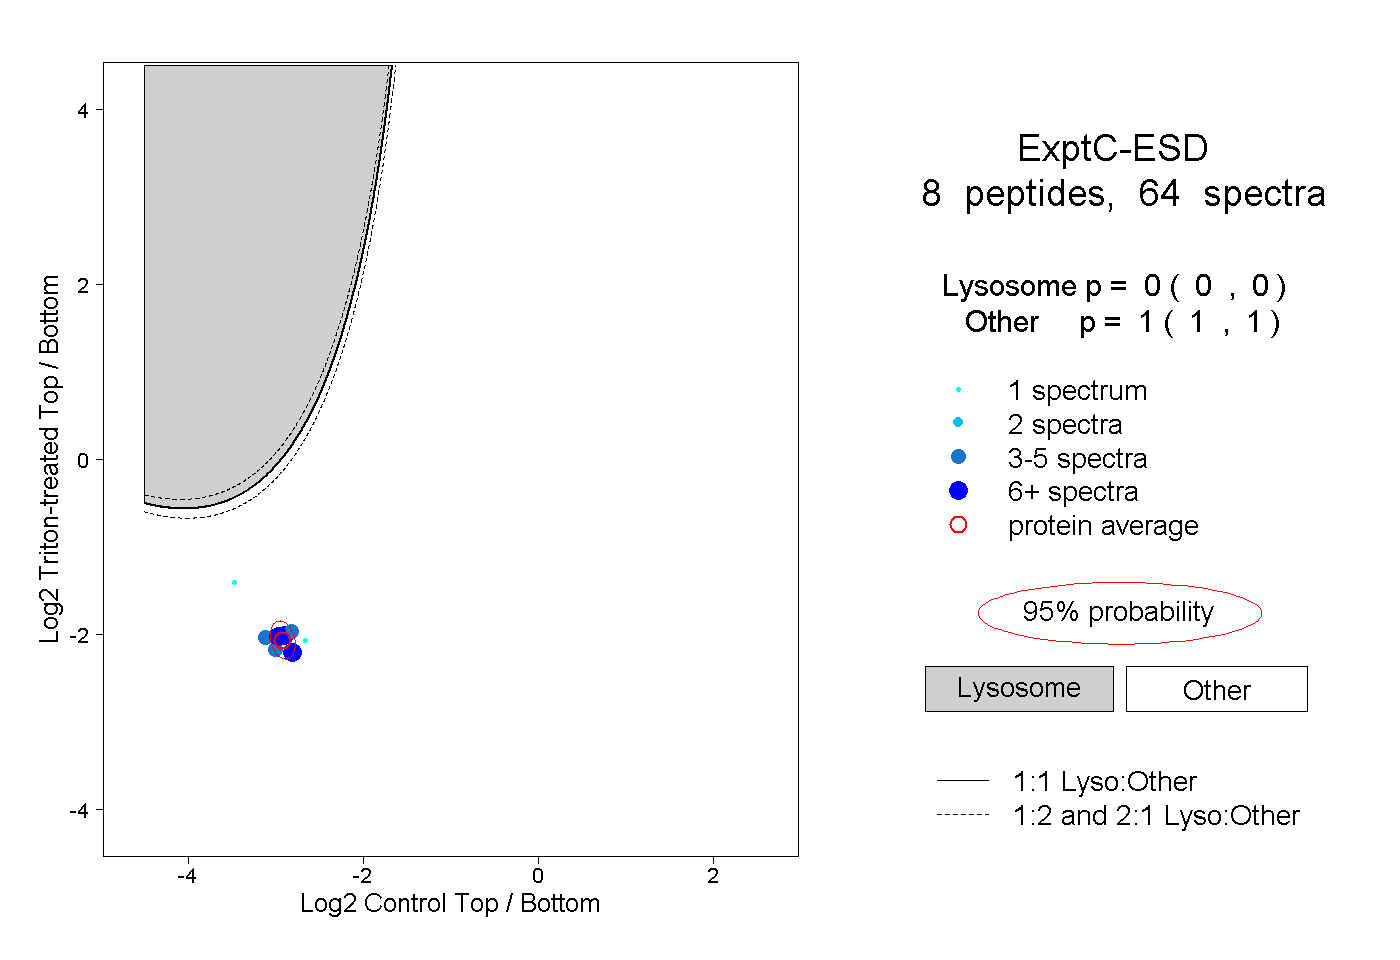
0.000 | 0.000
1.000 | 1.000
1peptide
spectra
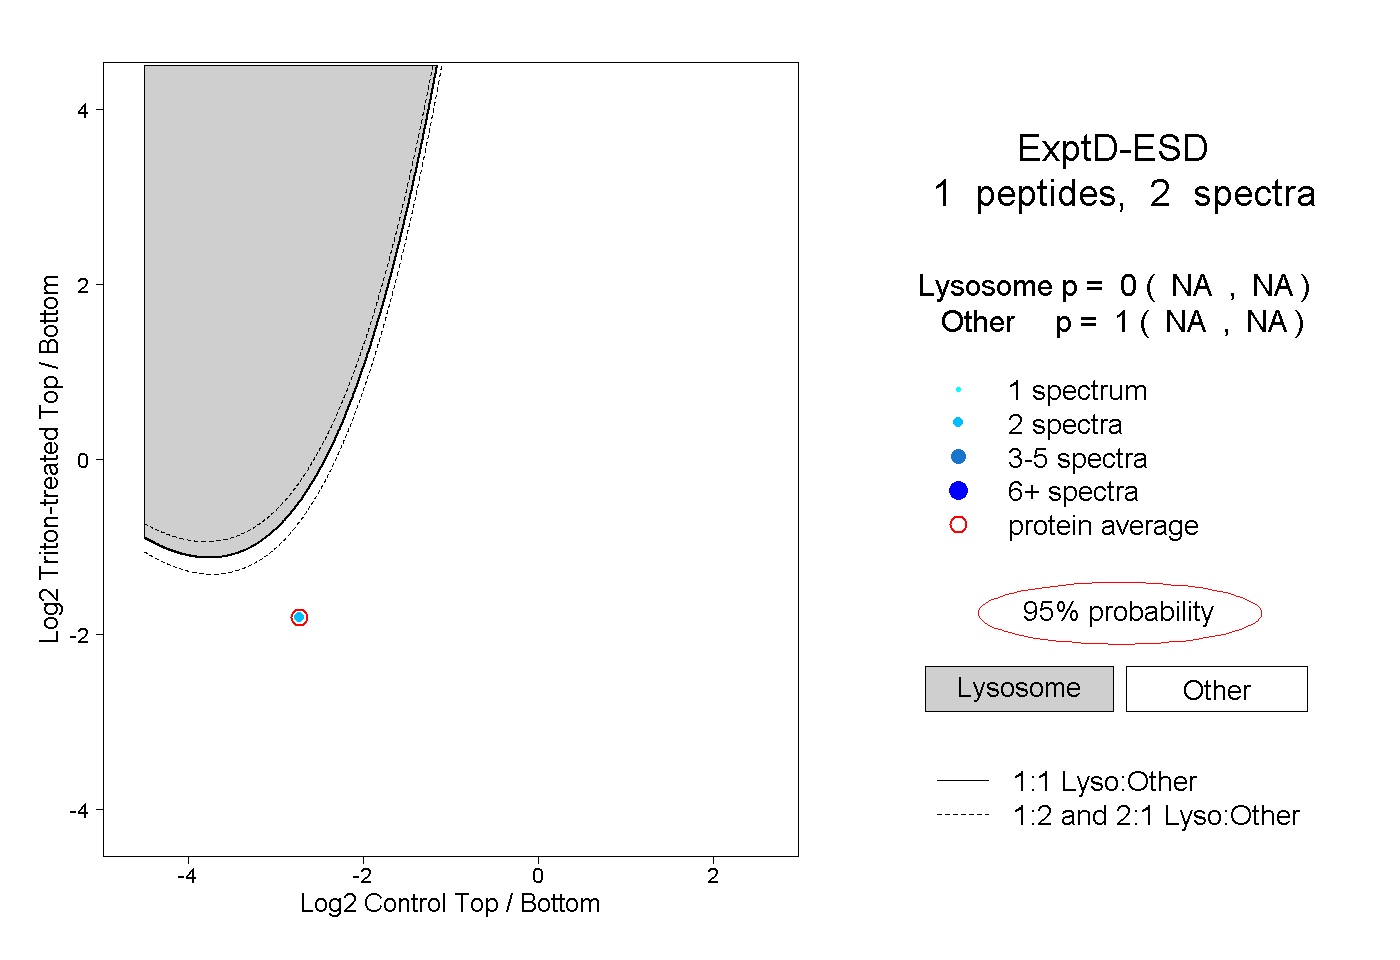
NA | NA
NA | NA