 13
13peptides
spectra
0.000 | 0.000
0.000 | 0.000
0.000 | 0.000
0.000 | 0.000
0.000 | 0.000
0.000 | 0.000
0.914 | 0.930
0.069 | 0.084
| Plot | Mito | Lyso | Perox | ER | Golgi | PM | Cytosol | Nucleus | |||||
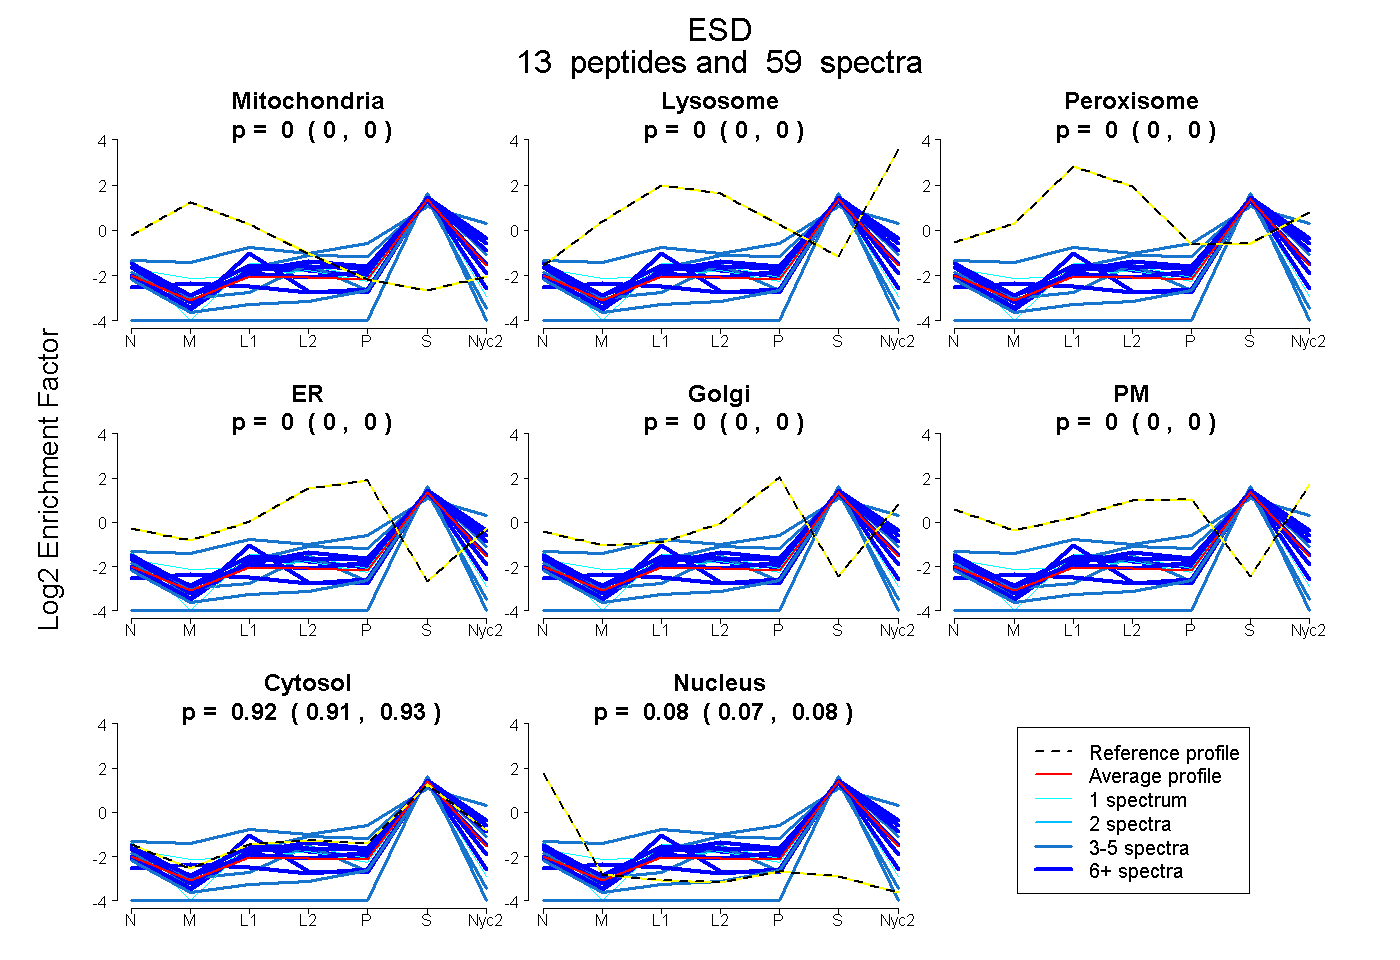
| Expt A |
13 peptides |
59 spectra |
|
0.000 0.000 | 0.000 |
0.000 0.000 | 0.000 |
0.000 0.000 | 0.000 |
0.000 0.000 | 0.000 |
0.000 0.000 | 0.000 |
0.000 0.000 | 0.000 |
0.923 0.914 | 0.930 |
0.077 0.069 | 0.084 |
| 6 spectra, AYDATCLVK | 0.000 | 0.000 | 0.000 | 0.000 | 0.000 | 0.000 | 0.945 | 0.055 | ||
| 3 spectra, AFNGYLGPDQSK | 0.000 | 0.000 | 0.000 | 0.000 | 0.000 | 0.000 | 0.993 | 0.007 | ||
| 6 spectra, FAIYLPPQAESAK | 0.000 | 0.000 | 0.000 | 0.000 | 0.000 | 0.000 | 0.844 | 0.156 | ||
| 3 spectra, ISIFGHSMGGHGALICALK | 0.000 | 0.217 | 0.000 | 0.000 | 0.031 | 0.000 | 0.752 | 0.000 | ||
| 6 spectra, VFEHSSVELK | 0.000 | 0.000 | 0.000 | 0.000 | 0.000 | 0.000 | 0.900 | 0.100 | ||
| 6 spectra, QISSNK | 0.000 | 0.000 | 0.000 | 0.000 | 0.000 | 0.000 | 0.992 | 0.008 | ||
| 1 spectrum, CPALYWLSGLTCTEQNFISK | 0.000 | 0.000 | 0.000 | 0.000 | 0.000 | 0.000 | 0.832 | 0.168 | ||
| 4 spectra, LQEGYDHSYYFIATFITDHIR | 0.000 | 0.000 | 0.000 | 0.000 | 0.000 | 0.000 | 0.719 | 0.281 | ||
| 5 spectra, SVSAFAPICNPVLCPWGK | 0.000 | 0.000 | 0.000 | 0.000 | 0.000 | 0.000 | 0.703 | 0.297 | ||
| 9 spectra, IPVVFR | 0.000 | 0.000 | 0.000 | 0.000 | 0.000 | 0.000 | 1.000 | 0.000 | ||
| 6 spectra, SGCQQAASEHGLVVIAPDTSPR | 0.000 | 0.000 | 0.000 | 0.000 | 0.000 | 0.000 | 1.000 | 0.000 | ||
| 1 spectrum, DDEFLSNGQLLPDNFIAACTEK | 0.000 | 0.000 | 0.000 | 0.000 | 0.000 | 0.000 | 0.993 | 0.007 | ||
| 3 spectra, CFGGLQK | 0.000 | 0.000 | 0.000 | 0.000 | 0.000 | 0.000 | 0.933 | 0.067 |
| Plot | Mito | Lyso or Perox | ER | Golgi | PM | Cytosol | Nucleus | ||||||
| Expt B |
6 peptides |
13 spectra |
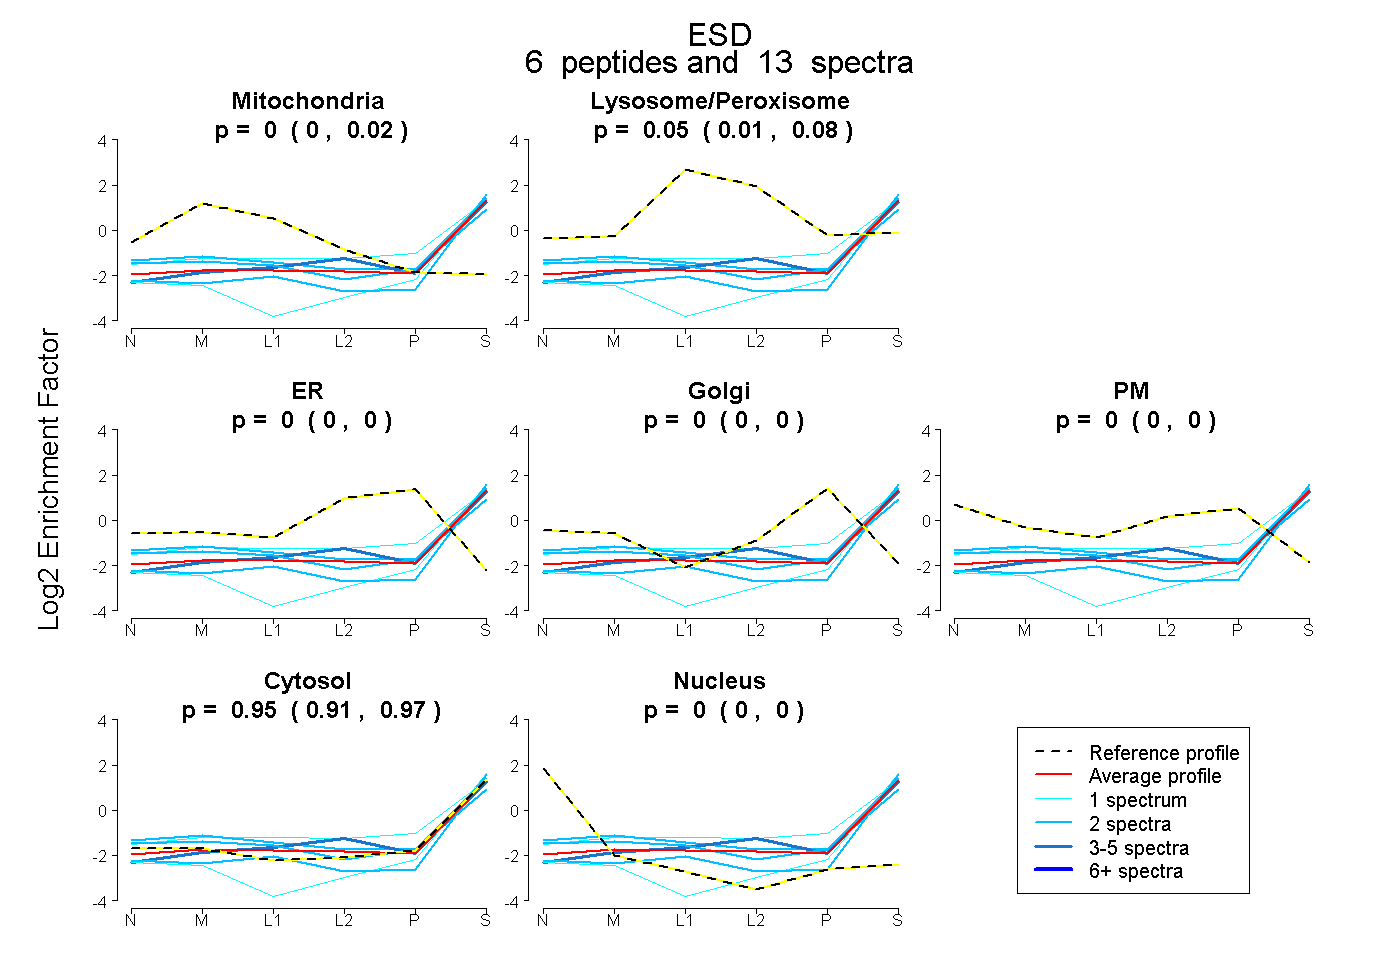 |
0.000 0.000 | 0.020 |
0.053 0.014 | 0.082 |
0.000 0.000 | 0.000 |
0.000 0.000 | 0.000 |
0.000 0.000 | 0.000 |
0.947 0.913 | 0.971 |
0.000 0.000 | 0.000 |
|||
| Plot | Lyso | Other | |||||||||||
| Expt C |
8 peptides |
64 spectra |
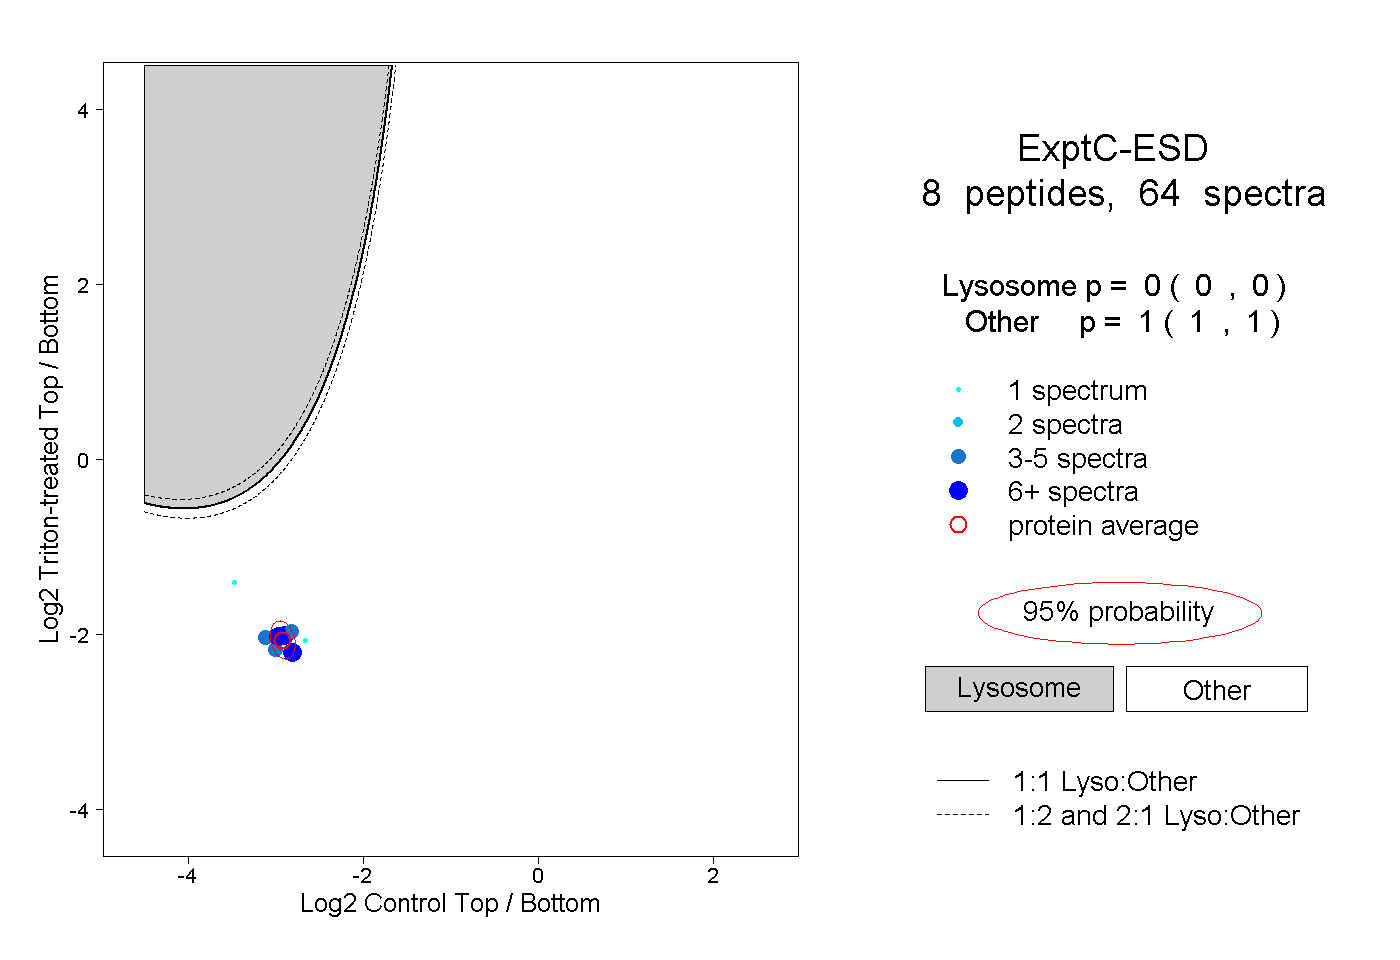 |
0.000 0.000 | 0.000 |
1.000 1.000 | 1.000 |
||||||||
| Plot | Lyso | Other | |||||||||||
| Expt D |
1 peptide |
2 spectra |
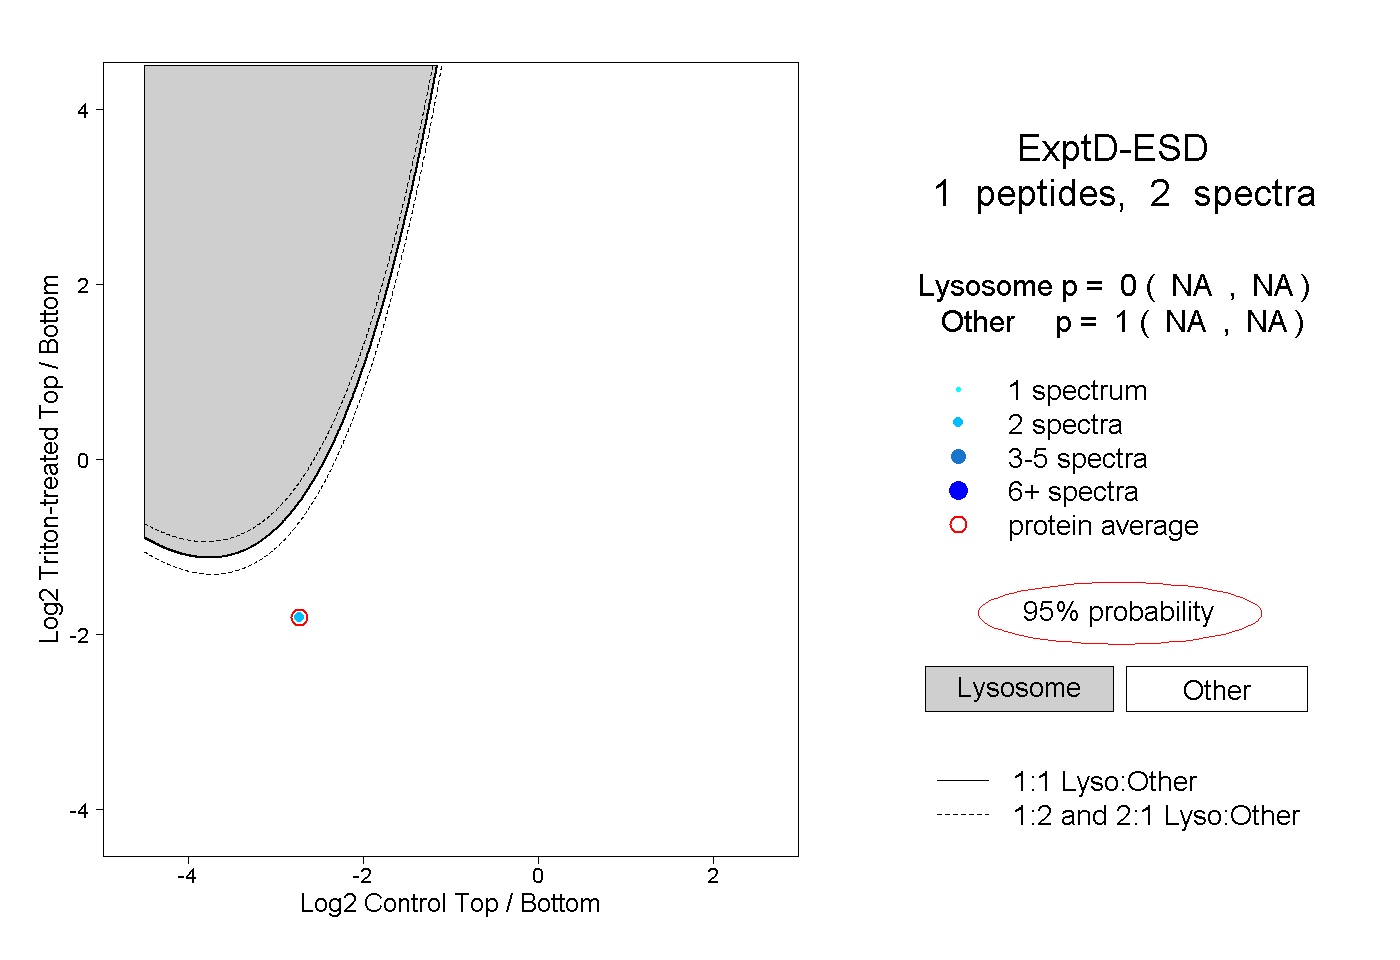 |
0.000 NA | NA |
1.000 NA | NA |