 17
17peptides
spectra
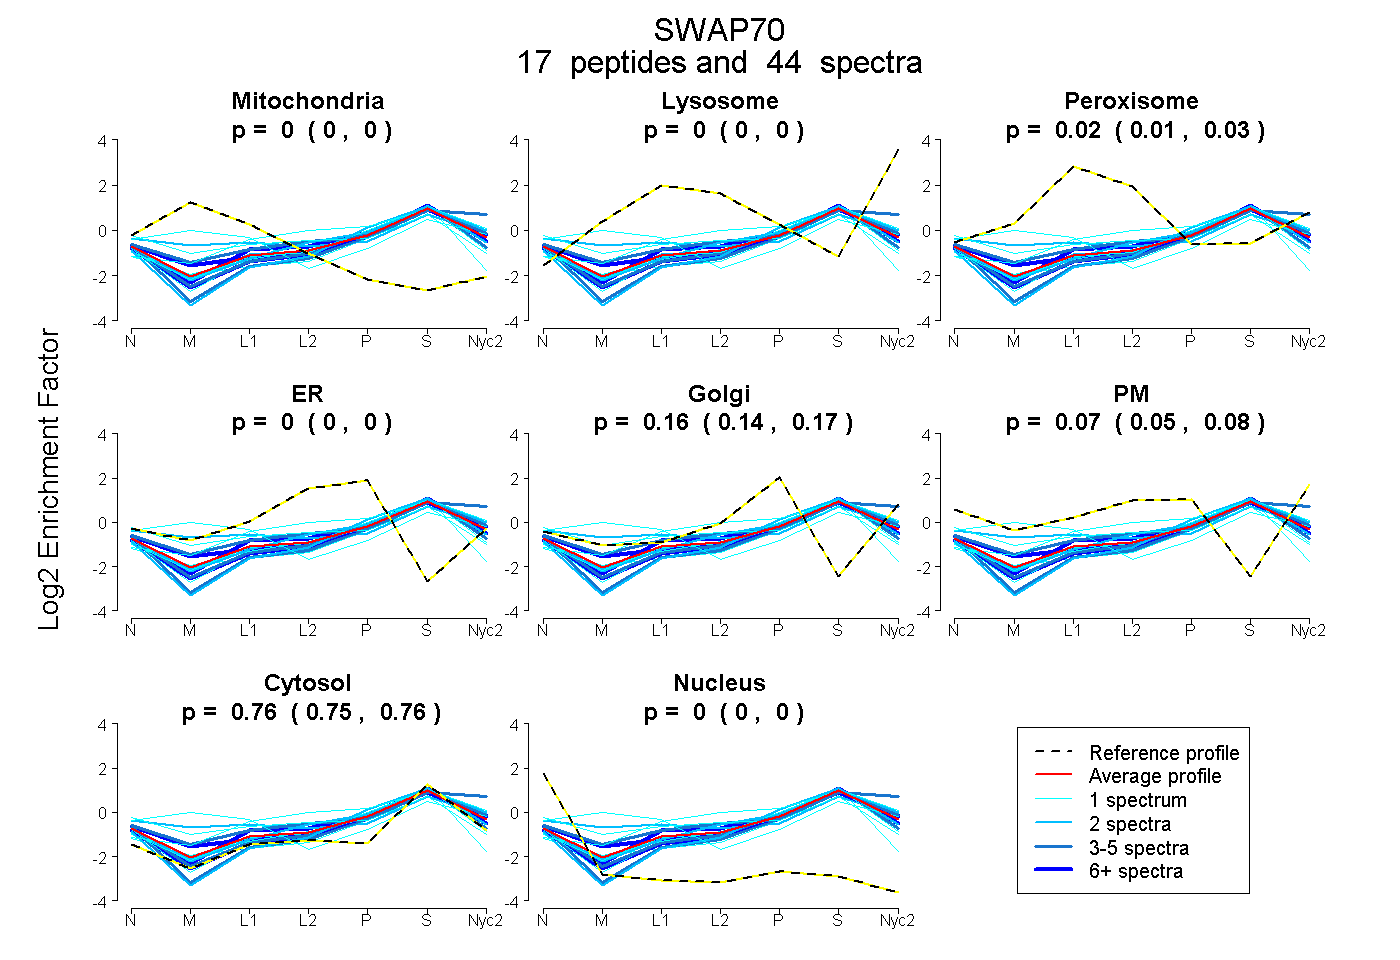
0.000 | 0.000
0.000 | 0.000
0.010 | 0.028
0.000 | 0.000
0.144 | 0.169
0.049 | 0.083
0.750 | 0.760
0.000 | 0.000
7peptides
spectra
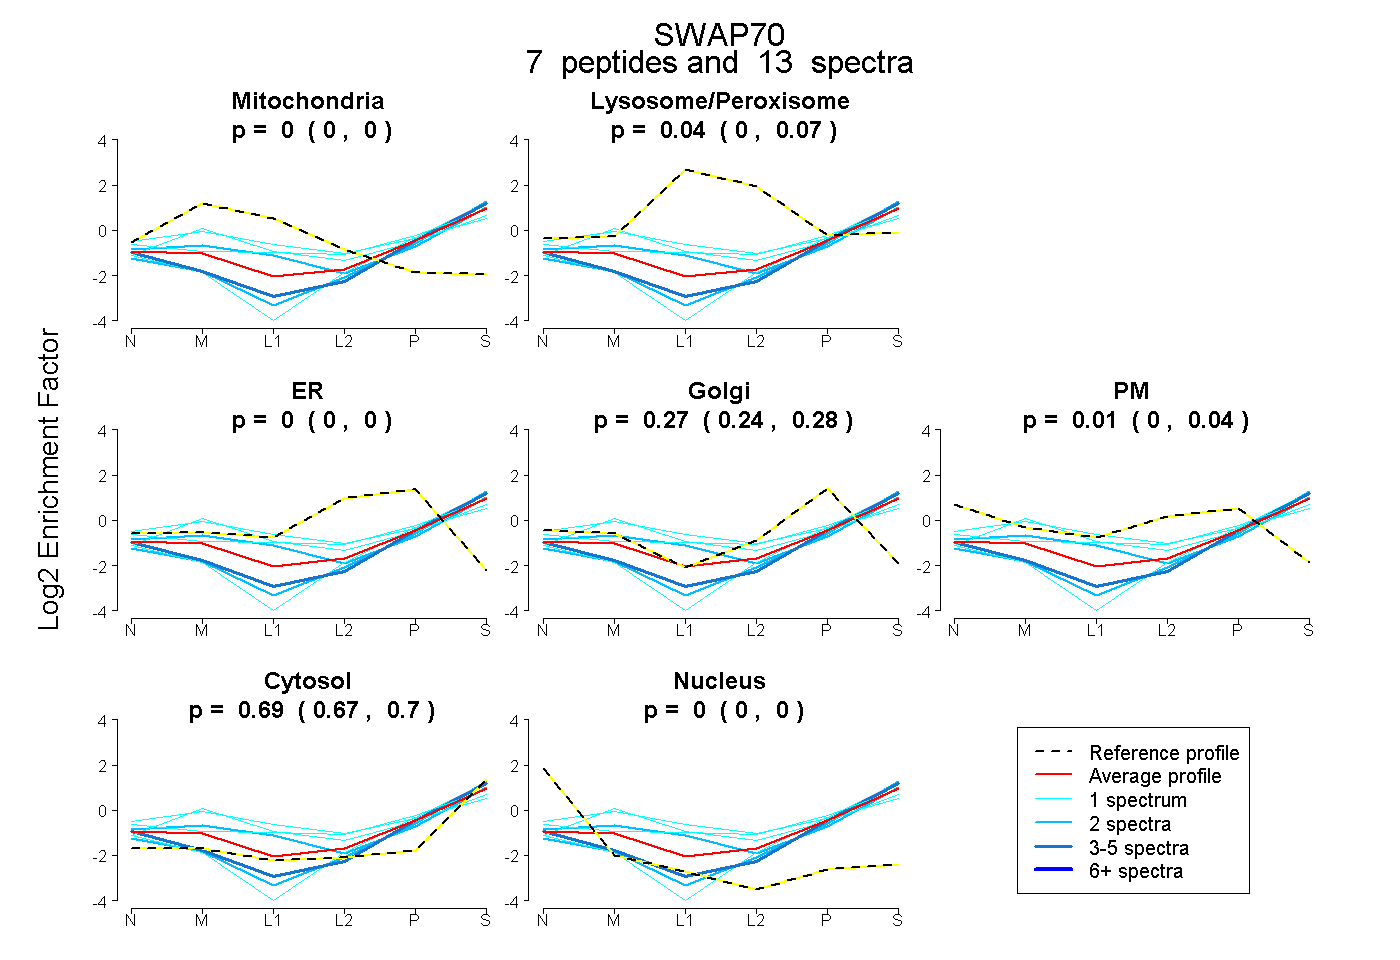
0.000 | 0.000
0.000 | 0.071
0.000 | 0.000
0.240 | 0.282
0.000 | 0.044
0.669 | 0.703
0.000 | 0.000
12peptides
spectra
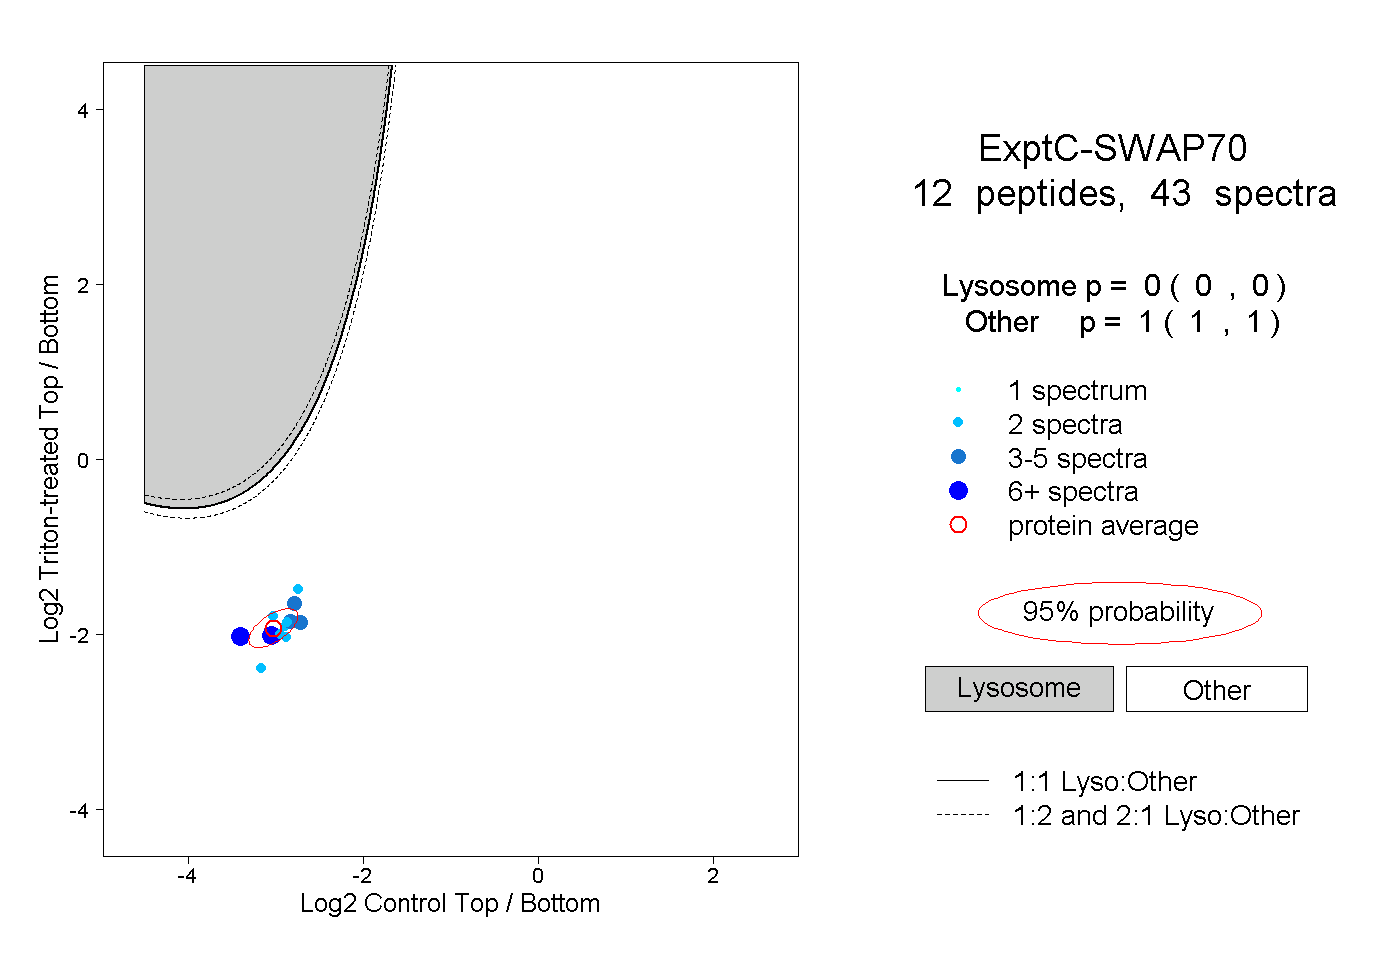
0.000 | 0.000
1.000 | 1.000
2peptides
spectra
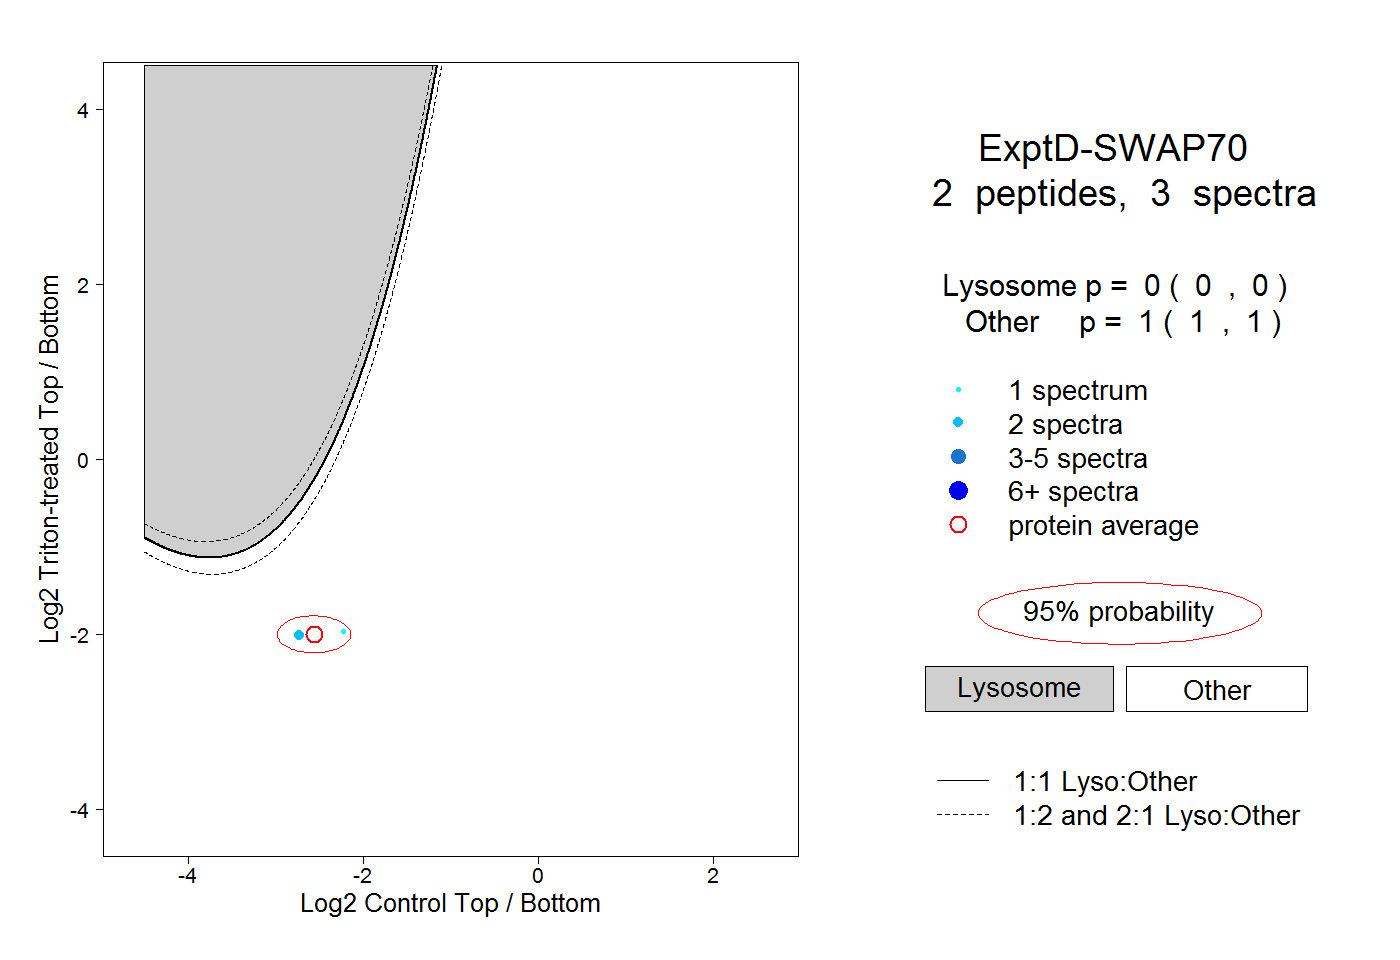
0.000 | 0.000
1.000 | 1.000