SWAP70
[ENSRNOP00000013276]
Main page
| | | Plot |
Mito |
Lyso |
|
Perox |
ER |
Golgi |
PM |
Cytosol |
Nucleus |
|
| Expt A |
 17
17
peptides |
44
spectra |
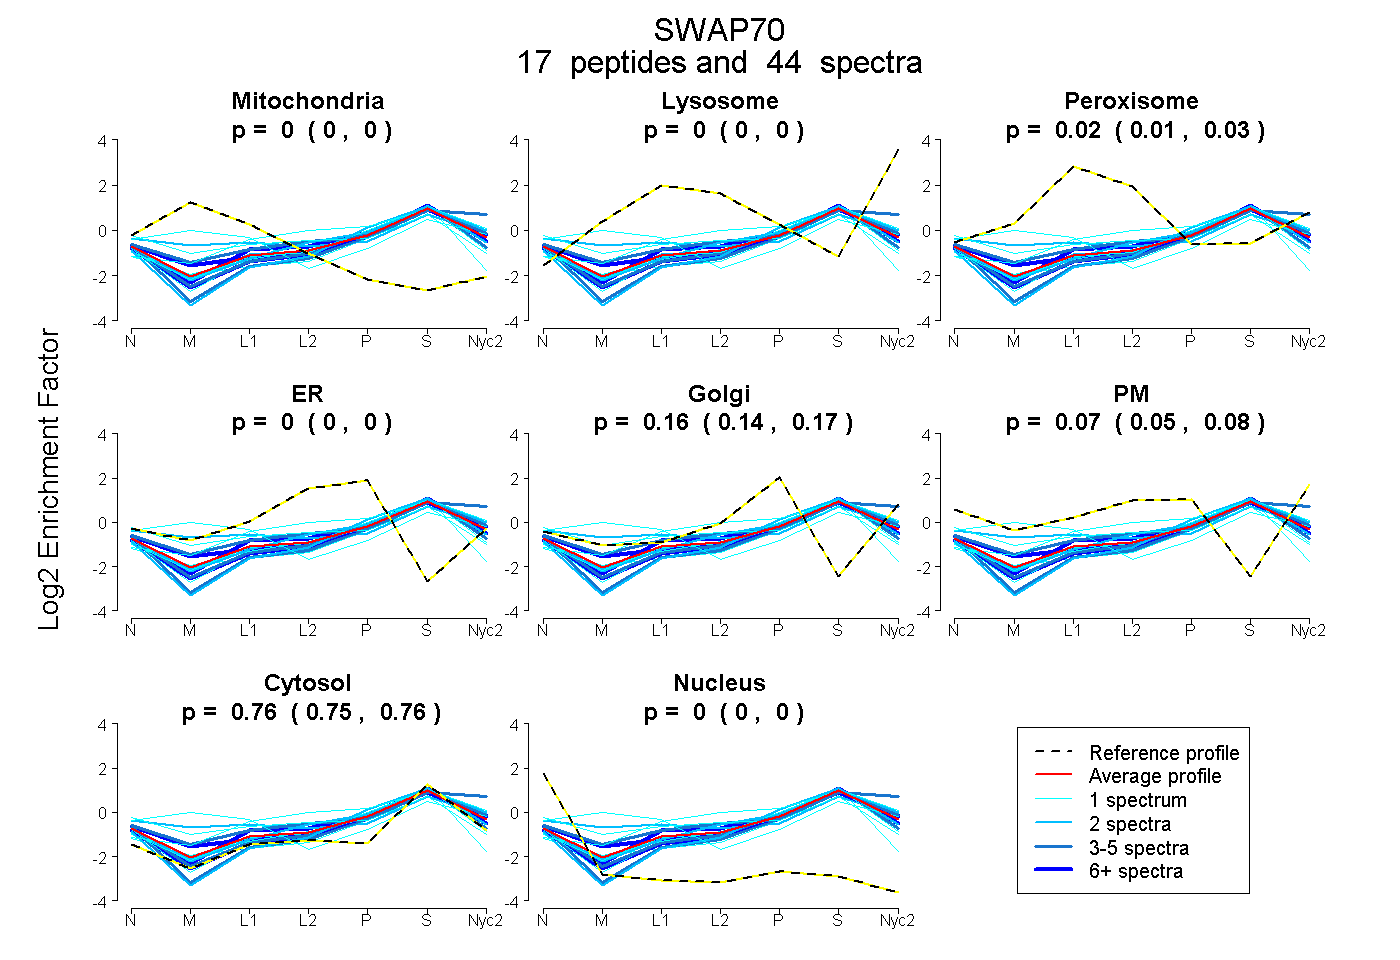 |
0.000
0.000 | 0.000 |
0.000
0.000 | 0.000 |
|
0.020
0.010 | 0.028 |
0.000
0.000 | 0.000 |
0.158
0.144 | 0.169 |
0.067
0.049 | 0.083 |
0.755
0.750 | 0.760 |
0.000
0.000 | 0.000 |
|
| | | Plot |
Mito |
|
Lyso or Perox |
|
ER |
Golgi |
PM |
Cytosol |
Nucleus |
|
| Expt B |
7
peptides |
13
spectra |
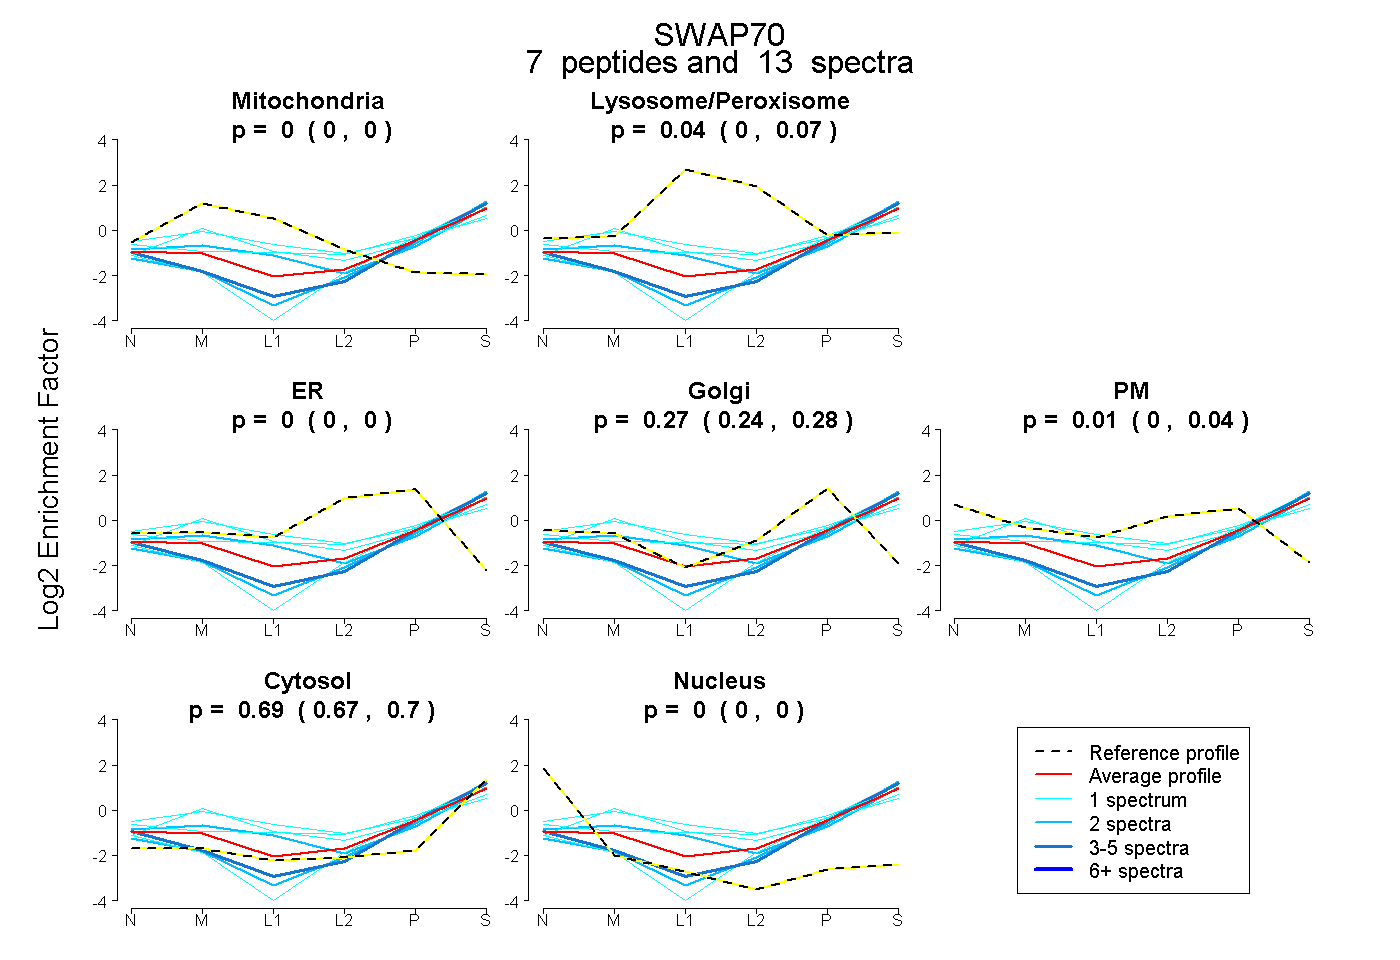 |
0.000
0.000 | 0.000 |
|
0.036
0.000 | 0.071 |
|
0.000
0.000 | 0.000 |
0.265
0.240 | 0.282 |
0.011
0.000 | 0.044 |
0.687
0.669 | 0.703 |
0.000
0.000 | 0.000 |
|
| | | Plot |
|
Lyso |
|
|
|
|
|
|
|
Other |
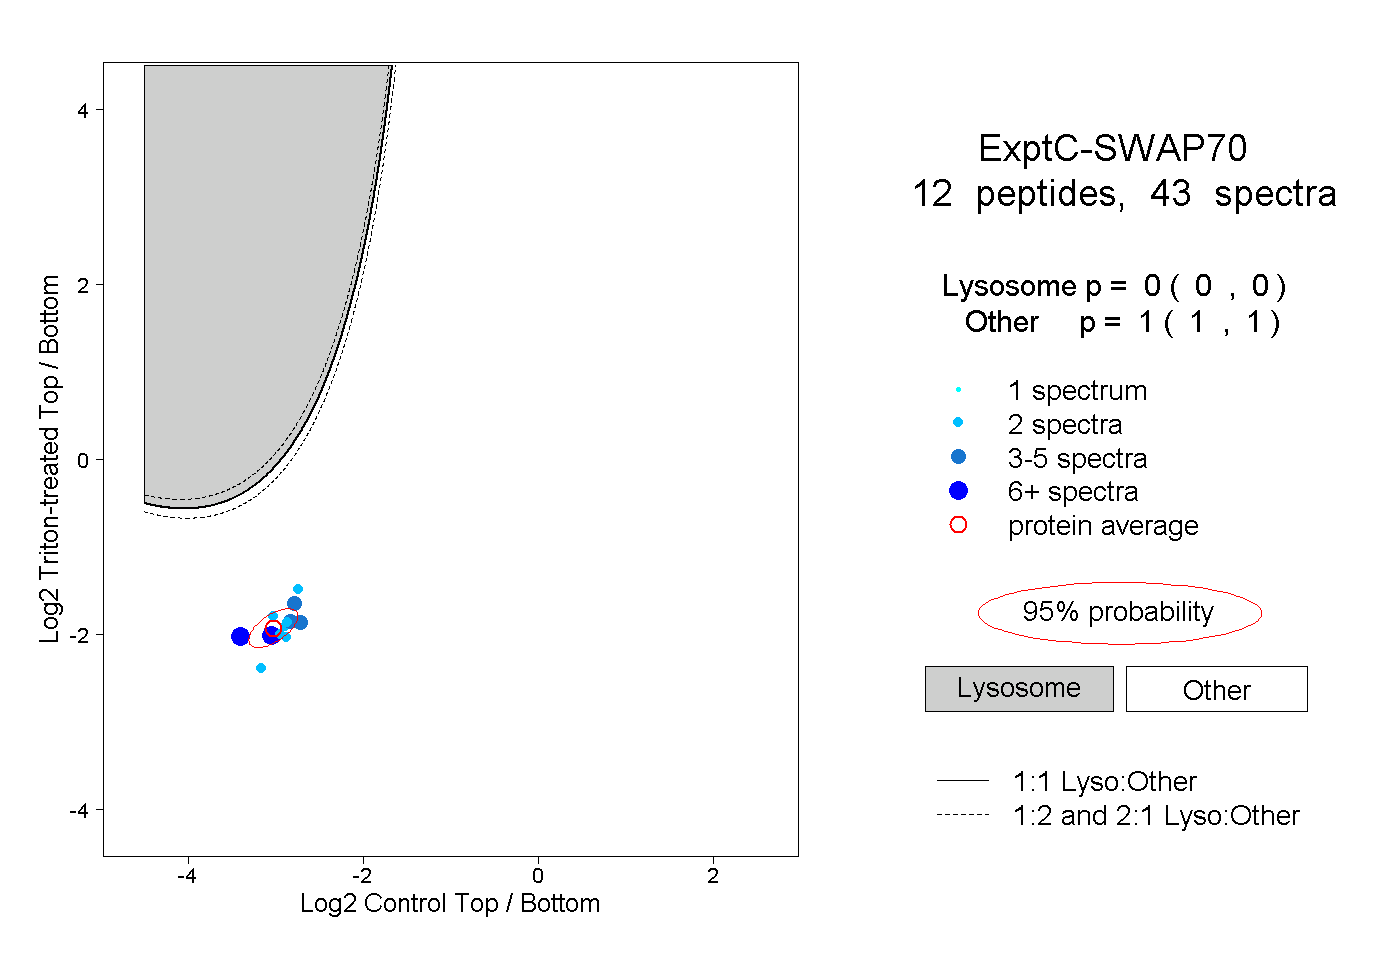
| Expt C |
12
peptides |
43
spectra |
 |
|
0.000
0.000 | 0.000 |
|
|
|
|
|
|
|
1.000
1.000 | 1.000 |
| 2 spectra, LIEPGSK |
|
0.000 |
|
|
|
|
|
|
|
1.000 |
| 2 spectra, QELEQQR |
|
0.000 |
|
|
|
|
|
|
|
1.000 |
| 4 spectra, LQEALEDER |
|
0.000 |
|
|
|
|
|
|
|
1.000 |
| 5 spectra, QQELESVR |
|
0.000 |
|
|
|
|
|
|
|
1.000 |
| 2 spectra, FSTELER |
|
0.000 |
|
|
|
|
|
|
|
1.000 |
| 2 spectra, CLFLIK |
|
0.000 |
|
|
|
|
|
|
|
1.000 |
| 11 spectra, AADEEK |
|
0.000 |
|
|
|
|
|
|
|
1.000 |
| 3 spectra, ELQAANENK |
|
0.000 |
|
|
|
|
|
|
|
1.000 |
| 2 spectra, QQMEEQVAQK |
|
0.000 |
|
|
|
|
|
|
|
1.000 |
| 6 spectra, LLAEQEELER |
|
0.000 |
|
|
|
|
|
|
|
1.000 |
| 2 spectra, LLEEESSK |
|
0.000 |
|
|
|
|
|
|
|
1.000 |
| 2 spectra, SSELEQYLQR |
|
0.000 |
|
|
|
|
|
|
|
1.000 |
| | | Plot |
|
Lyso |
|
|
|
|
|
|
|
Other |
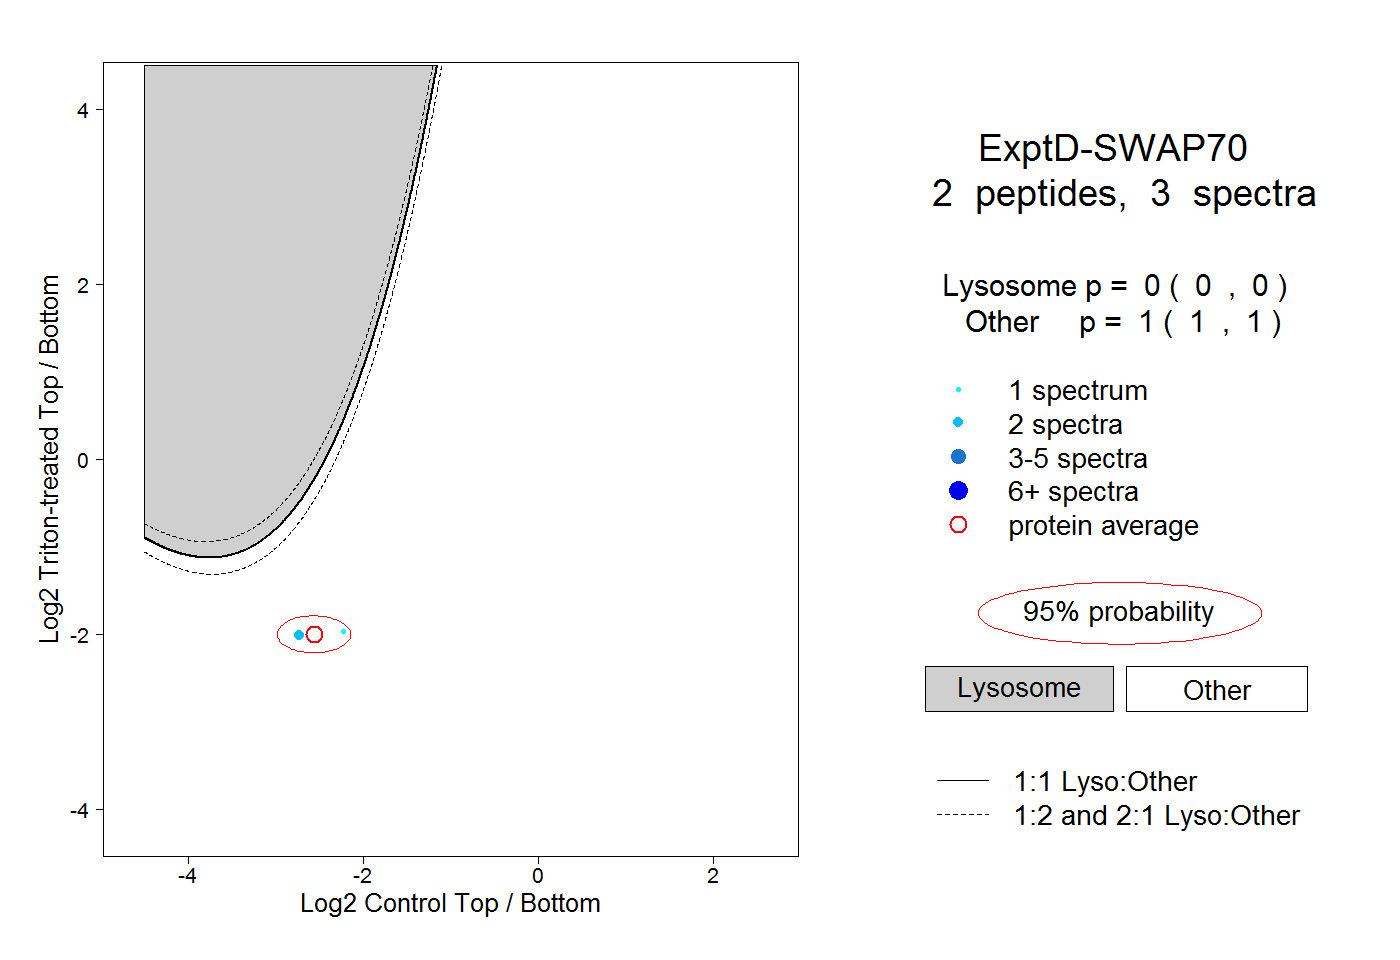
| Expt D |
2
peptides |
3
spectra |
 |
|
0.000
0.000 | 0.000 |
|
|
|
|
|
|
|
1.000
1.000 | 1.000 |