 6
6peptides
spectra
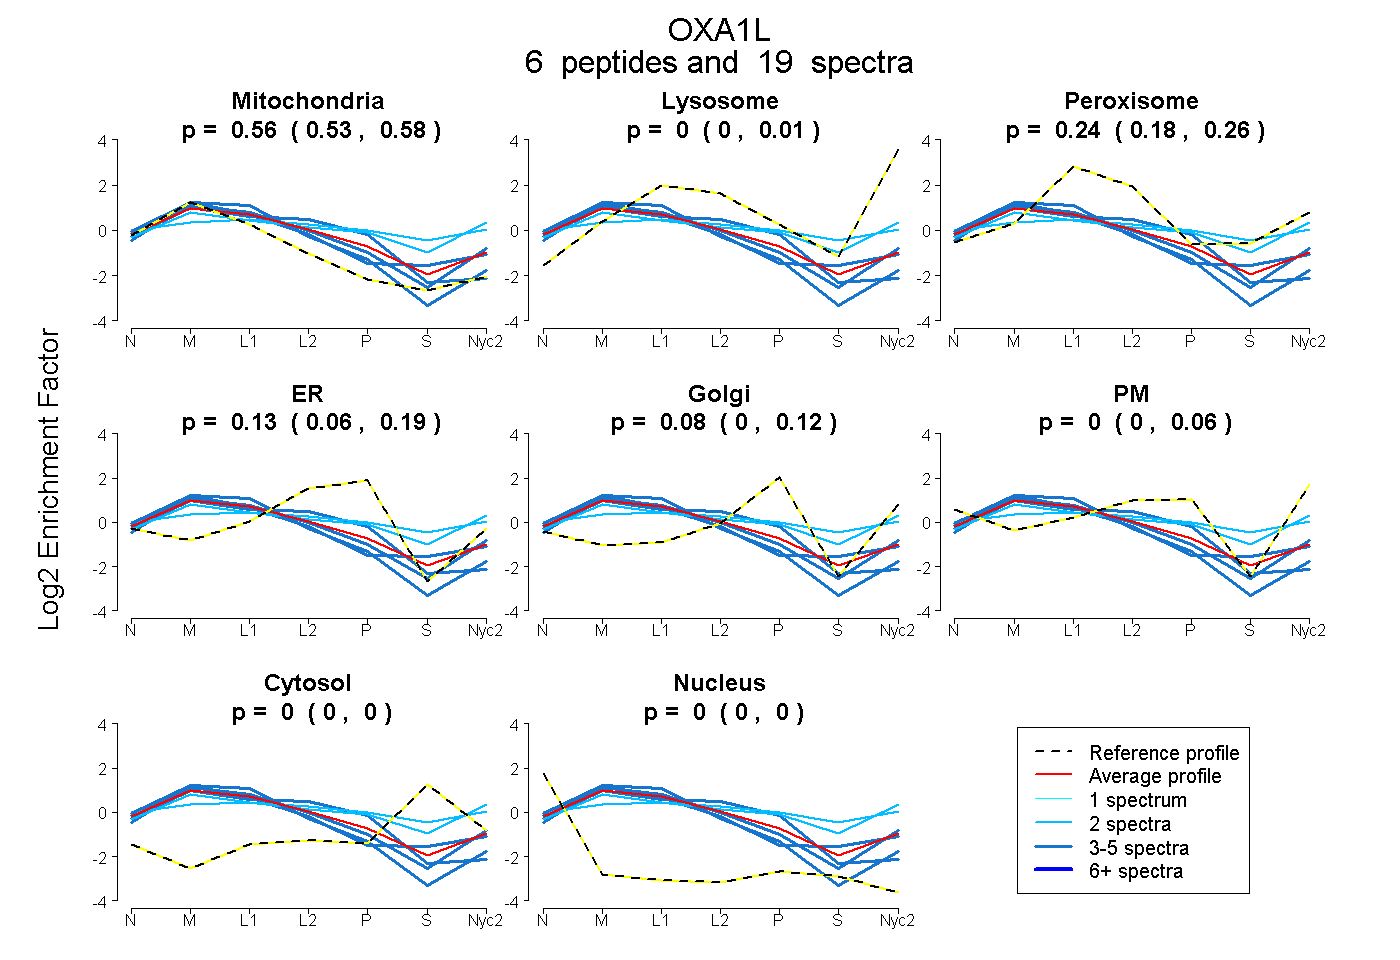
0.531 | 0.578
0.000 | 0.010
0.182 | 0.263
0.057 | 0.193
0.000 | 0.116
0.000 | 0.056
0.000 | 0.000
0.000 | 0.000
4peptides
spectra
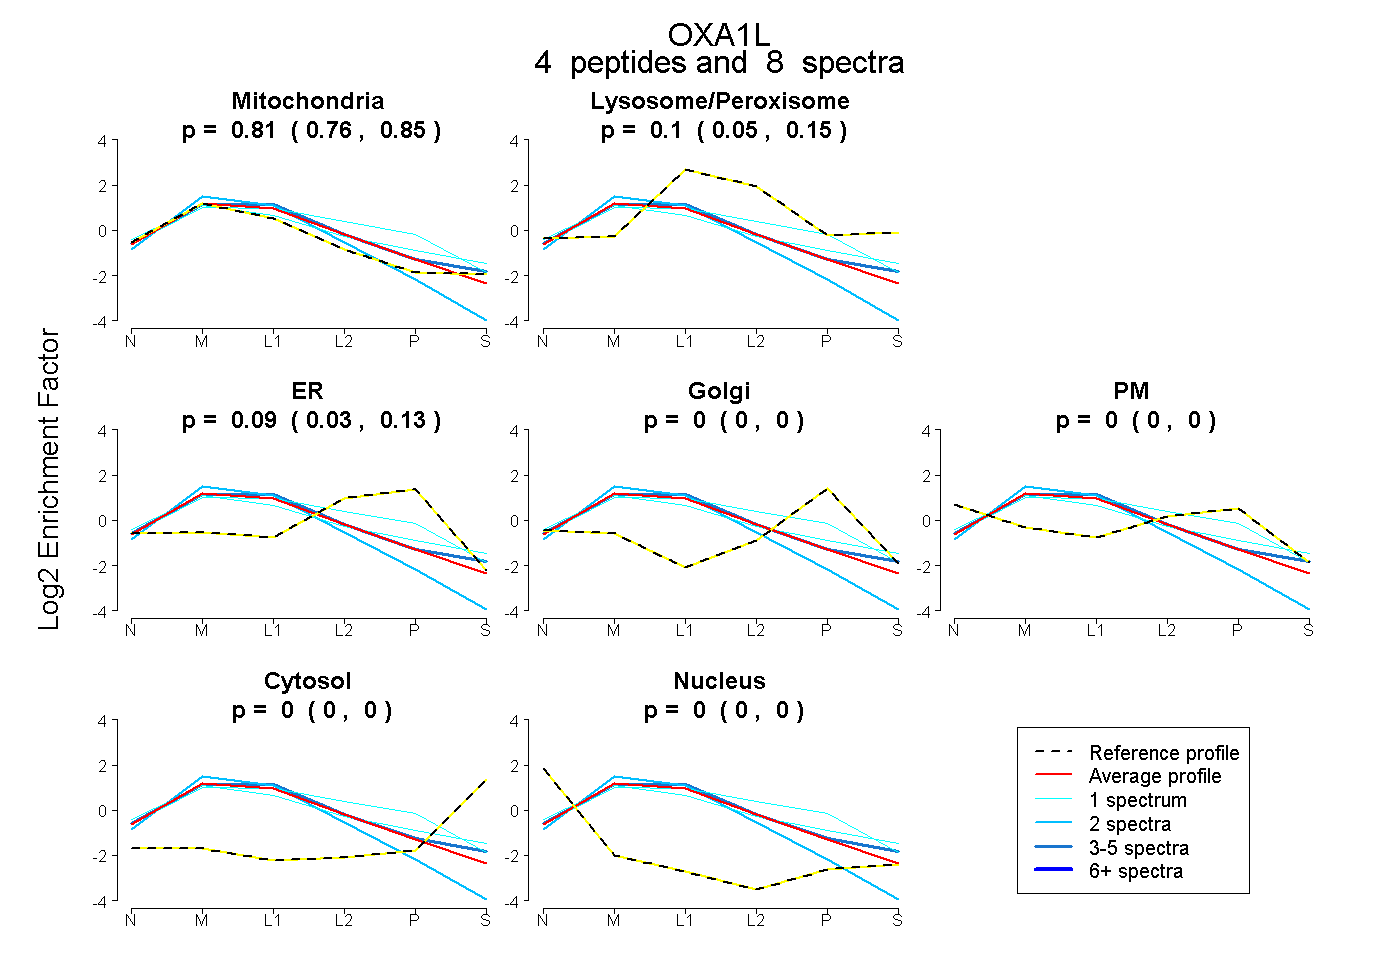
0.761 | 0.851
0.049 | 0.150
0.032 | 0.131
0.000 | 0.000
0.000 | 0.000
0.000 | 0.000
0.000 | 0.000
7peptides
spectra
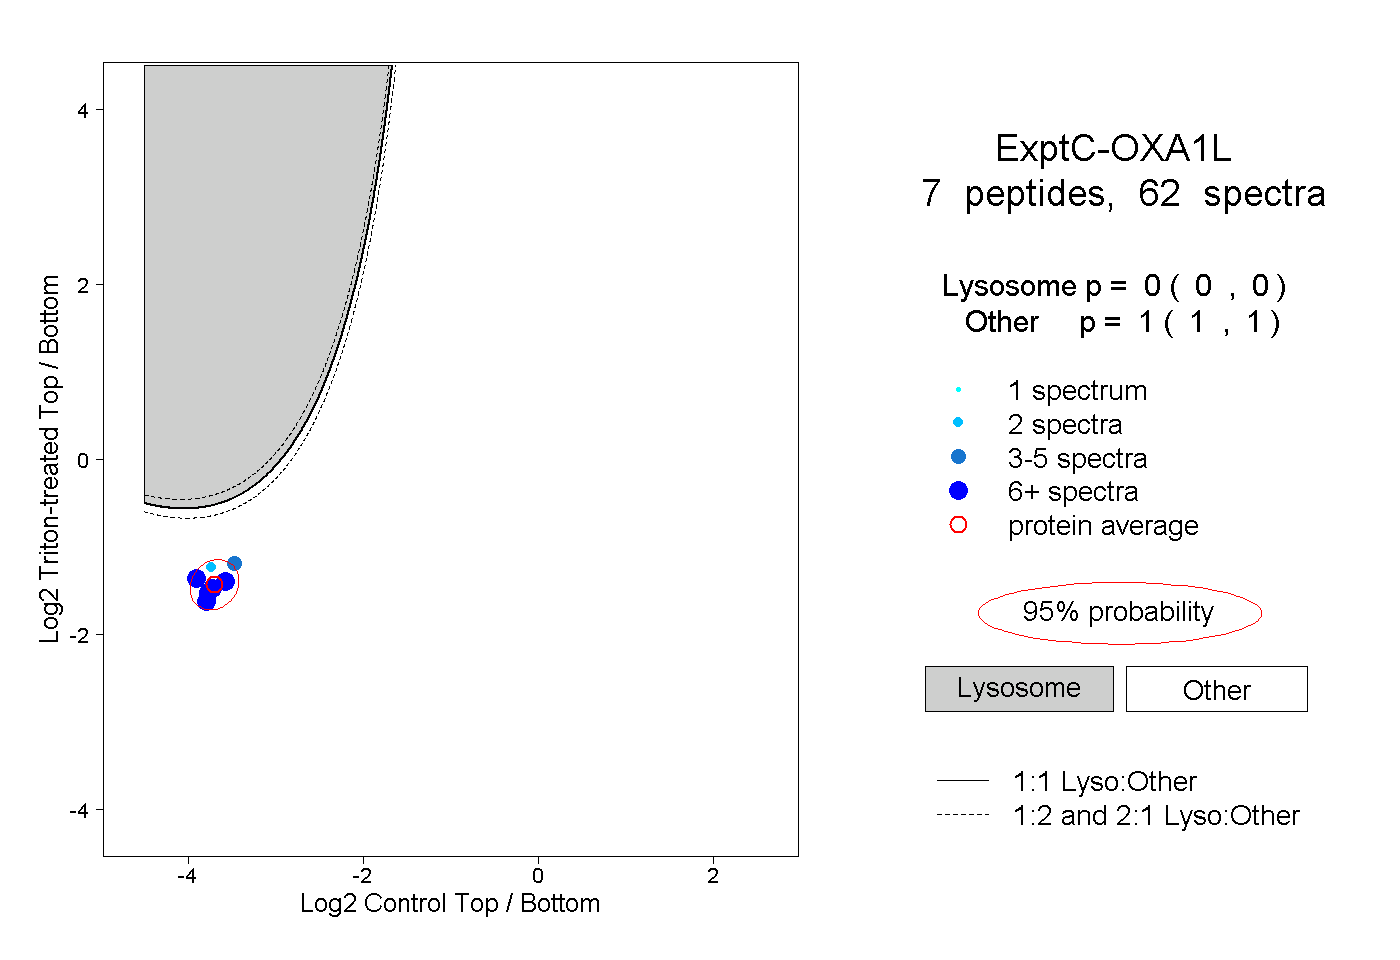
0.000 | 0.000
1.000 | 1.000
4peptides
spectra
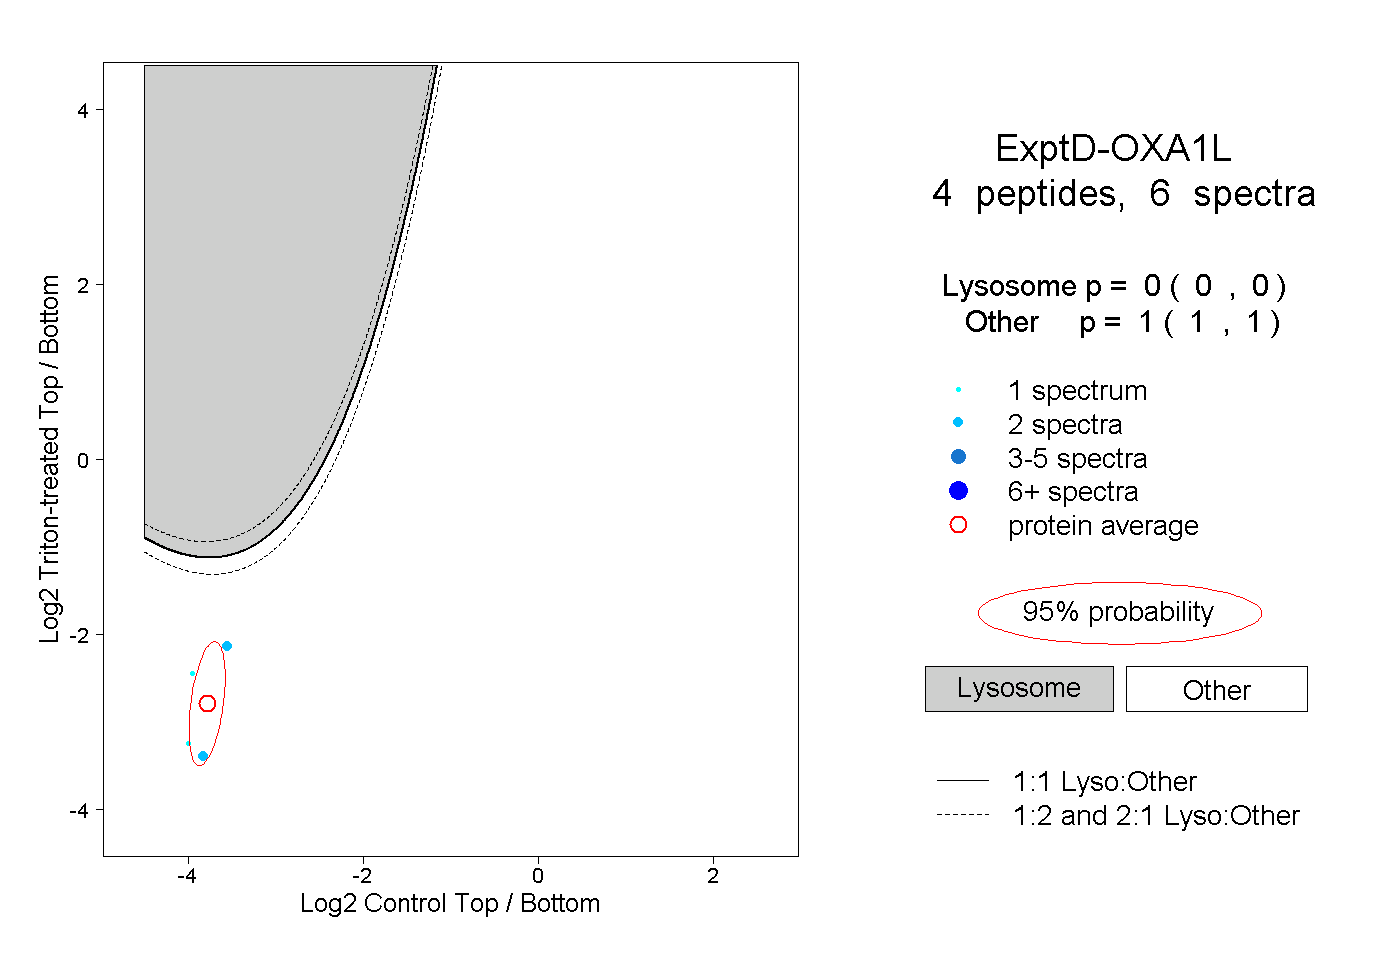
0.000 | 0.000
1.000 | 1.000