 6
6peptides
spectra
0.531 | 0.578
0.000 | 0.010
0.182 | 0.263
0.057 | 0.193
0.000 | 0.116
0.000 | 0.056
0.000 | 0.000
0.000 | 0.000
| Plot | Mito | Lyso | Perox | ER | Golgi | PM | Cytosol | Nucleus | |||||
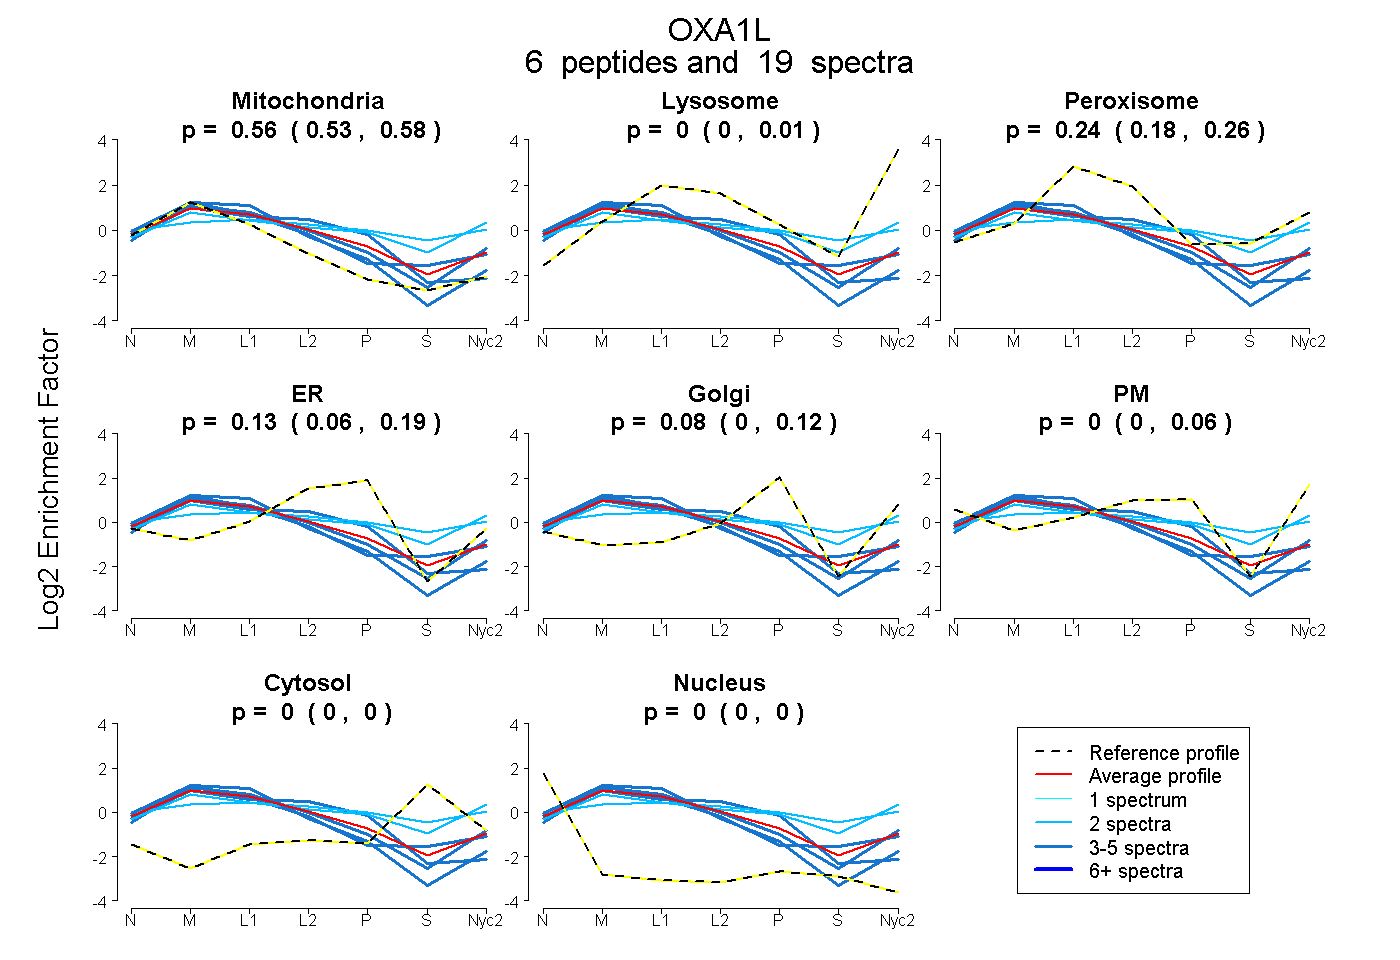
| Expt A |
6 peptides |
19 spectra |
|
0.555 0.531 | 0.578 |
0.000 0.000 | 0.010 |
0.237 0.182 | 0.263 |
0.132 0.057 | 0.193 |
0.075 0.000 | 0.116 |
0.000 0.000 | 0.056 |
0.000 0.000 | 0.000 |
0.000 0.000 | 0.000 |
| 3 spectra, SPNTPNSSTNSVK | 0.787 | 0.000 | 0.066 | 0.147 | 0.000 | 0.000 | 0.000 | 0.000 | ||
| 2 spectra, IHNHMPEMQK | 0.174 | 0.000 | 0.344 | 0.000 | 0.118 | 0.172 | 0.191 | 0.000 | ||
| 4 spectra, HLDLAAR | 0.662 | 0.050 | 0.235 | 0.000 | 0.000 | 0.000 | 0.052 | 0.000 | ||
| 2 spectra, QTFTHNPLLQHDPSR | 0.302 | 0.171 | 0.190 | 0.000 | 0.171 | 0.075 | 0.090 | 0.000 | ||
| 3 spectra, CLVFPLIVK | 0.578 | 0.000 | 0.052 | 0.370 | 0.000 | 0.000 | 0.000 | 0.000 | ||
| 5 spectra, ATIEMTHYQK | 0.624 | 0.045 | 0.121 | 0.066 | 0.000 | 0.144 | 0.000 | 0.000 |
| Plot | Mito | Lyso or Perox | ER | Golgi | PM | Cytosol | Nucleus | ||||||
| Expt B |
4 peptides |
8 spectra |
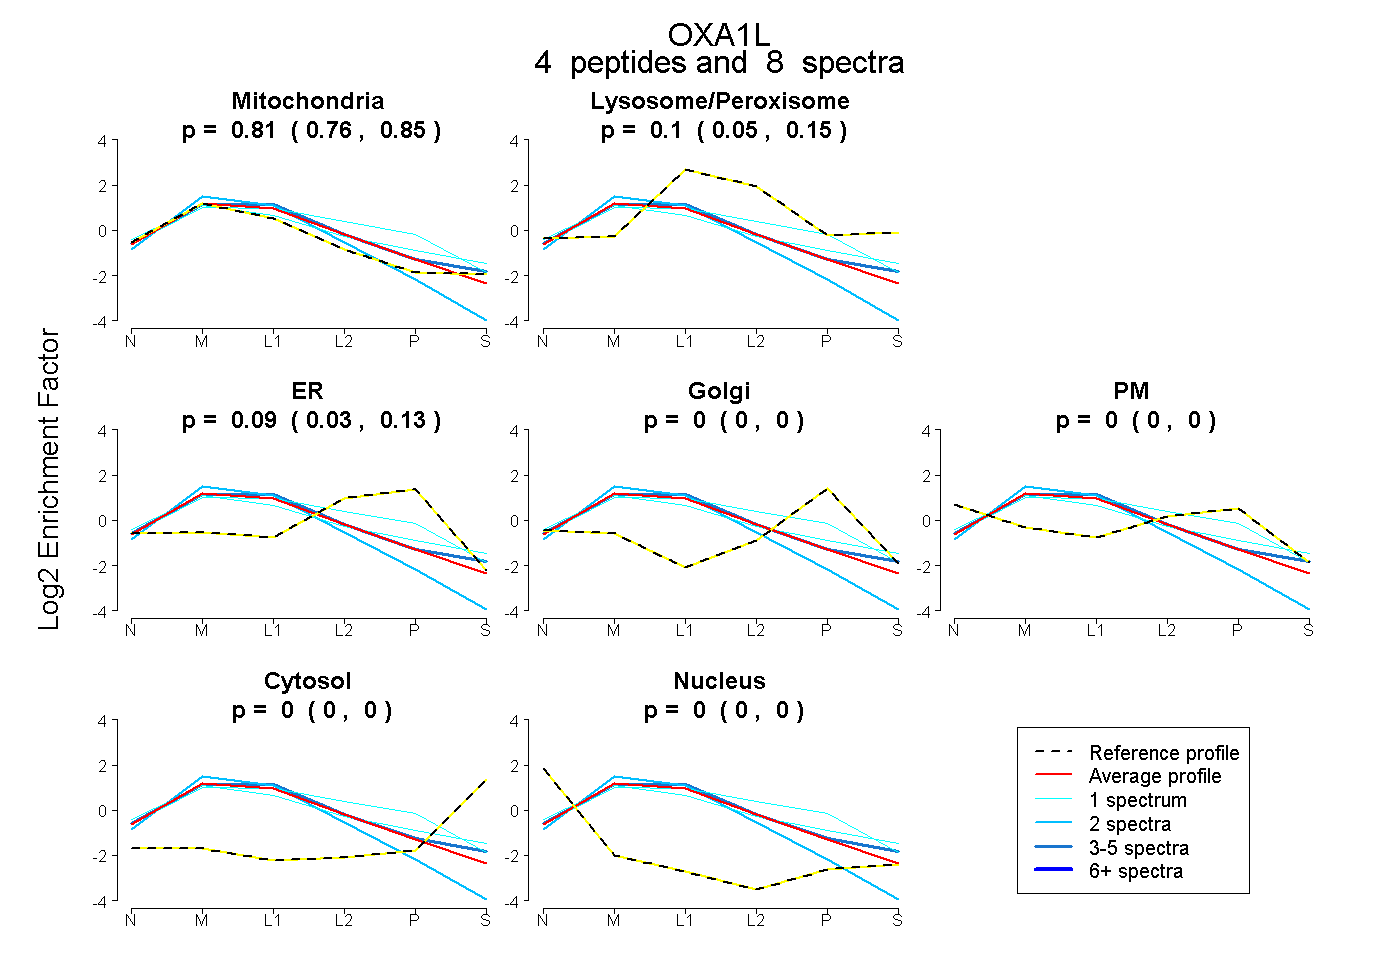 |
0.811 0.761 | 0.851 |
0.104 0.049 | 0.150 |
0.085 0.032 | 0.131 |
0.000 0.000 | 0.000 |
0.000 0.000 | 0.000 |
0.000 0.000 | 0.000 |
0.000 0.000 | 0.000 |
|||
| Plot | Lyso | Other | |||||||||||
| Expt C |
7 peptides |
62 spectra |
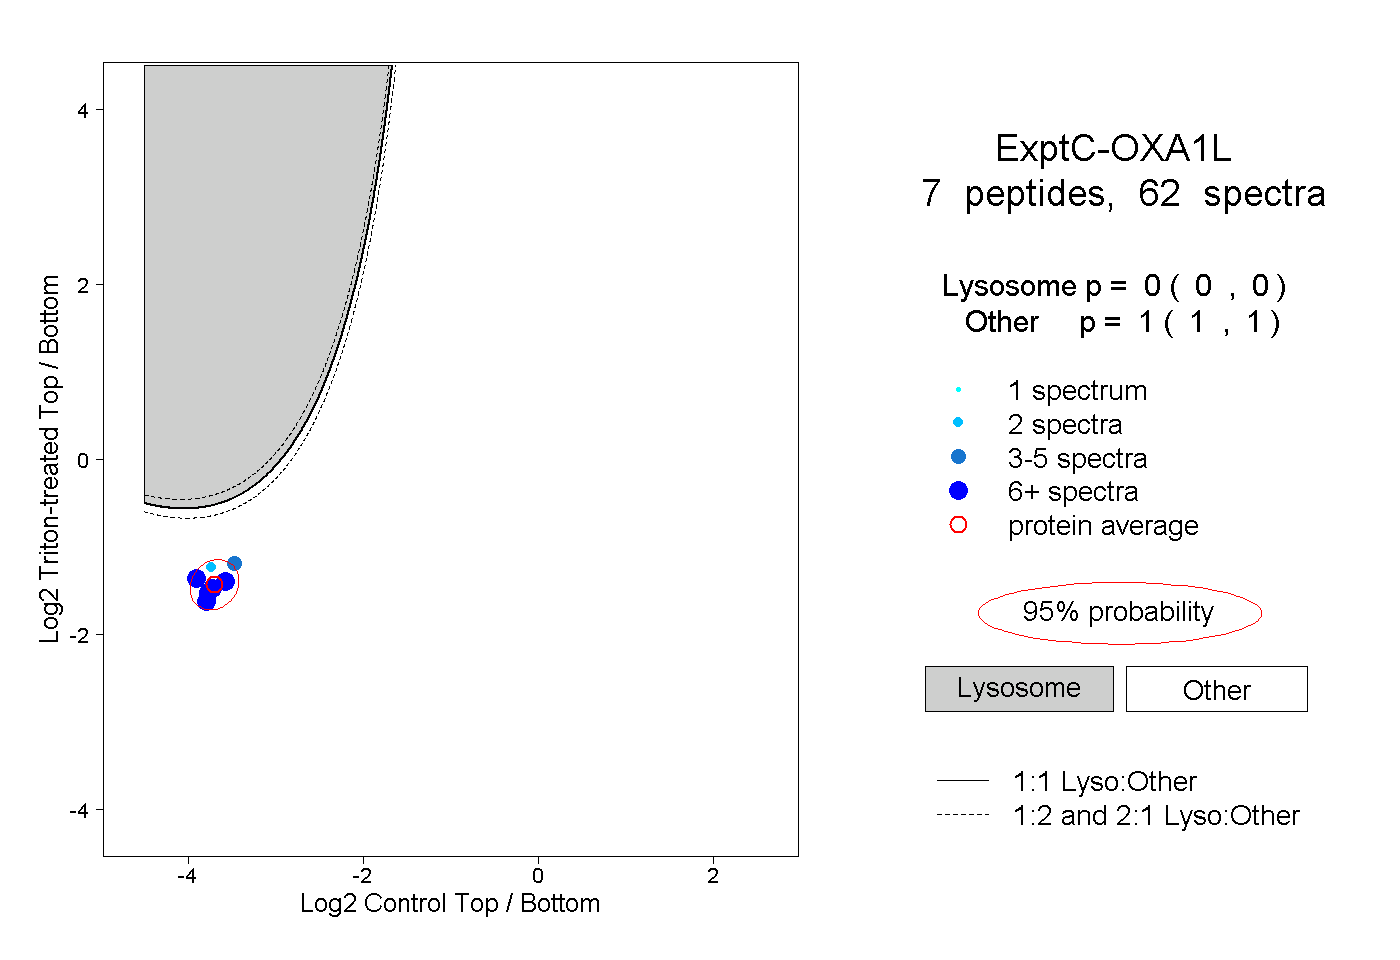 |
0.000 0.000 | 0.000 |
1.000 1.000 | 1.000 |
||||||||
| Plot | Lyso | Other | |||||||||||
| Expt D |
4 peptides |
6 spectra |
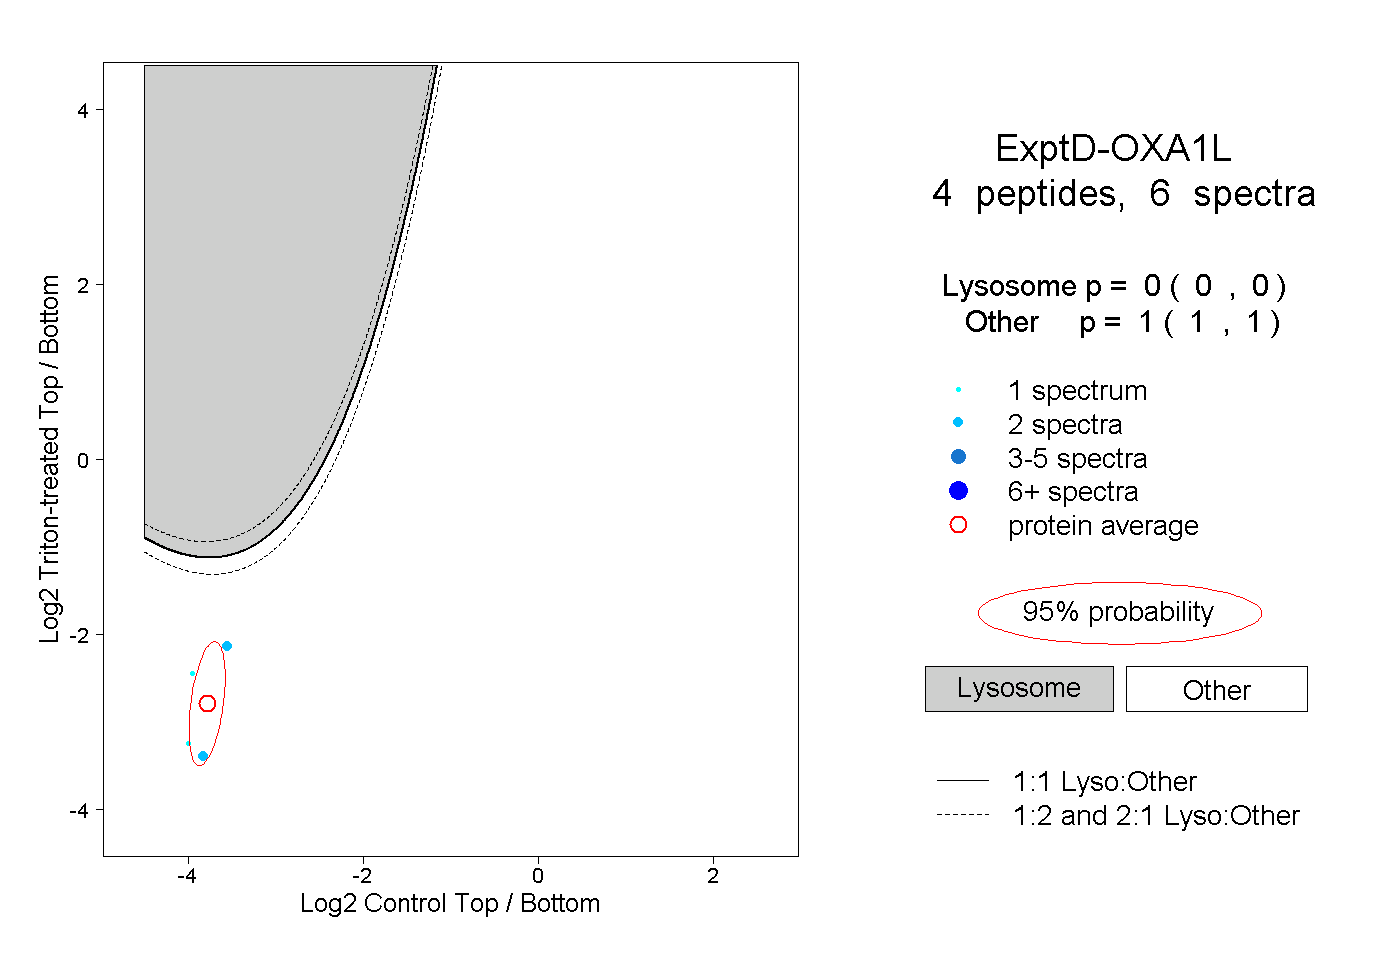 |
0.000 0.000 | 0.000 |
1.000 1.000 | 1.000 |