 12
12peptides
spectra
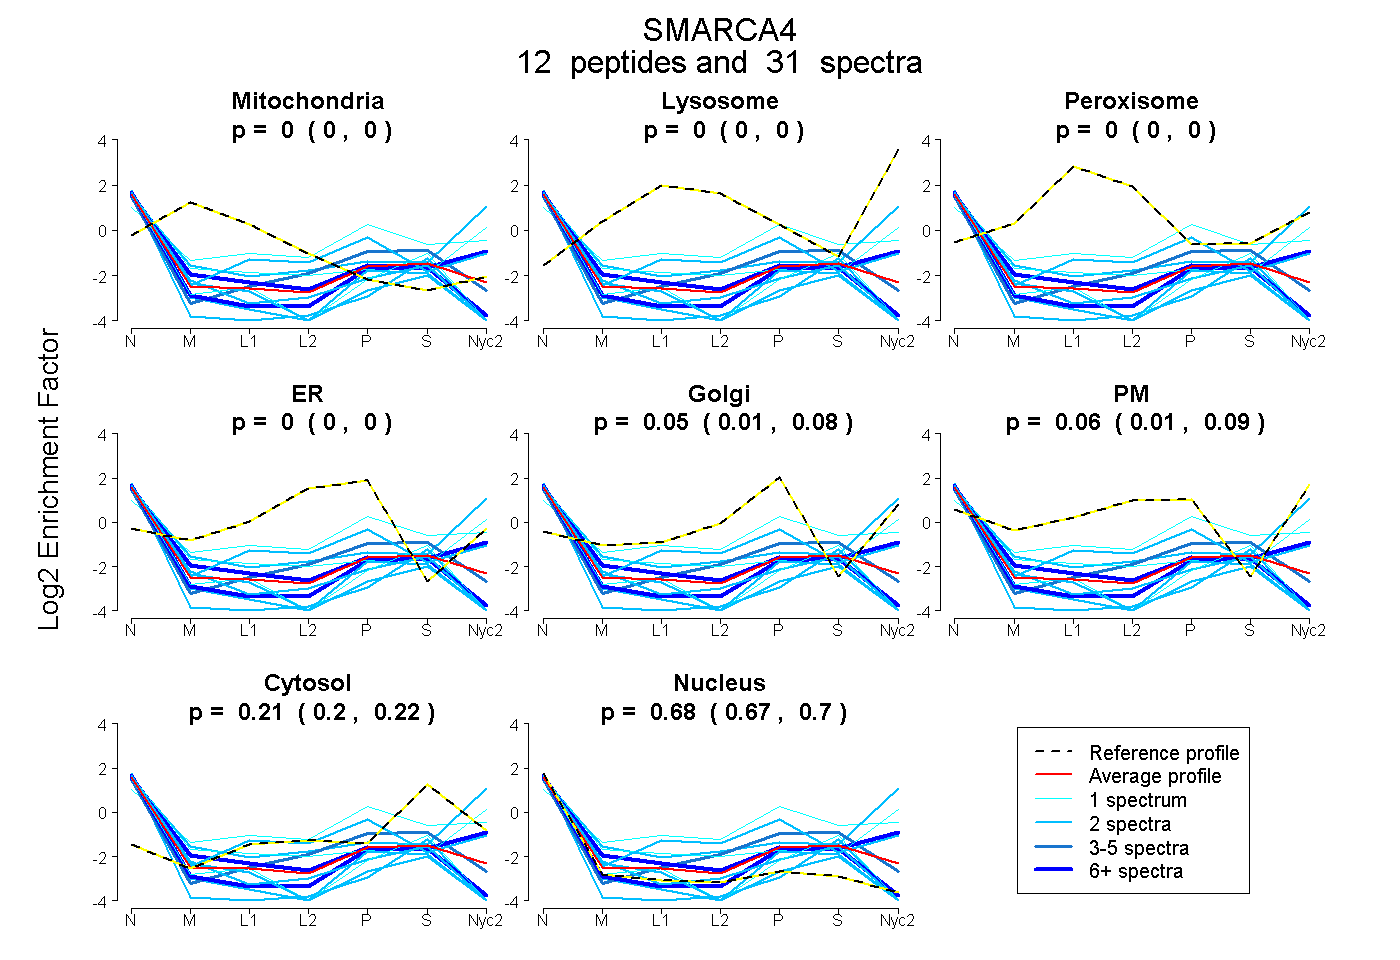
0.000 | 0.000
0.000 | 0.000
0.000 | 0.000
0.000 | 0.000
0.008 | 0.084
0.015 | 0.088
0.203 | 0.222
0.668 | 0.696
3peptides
spectra
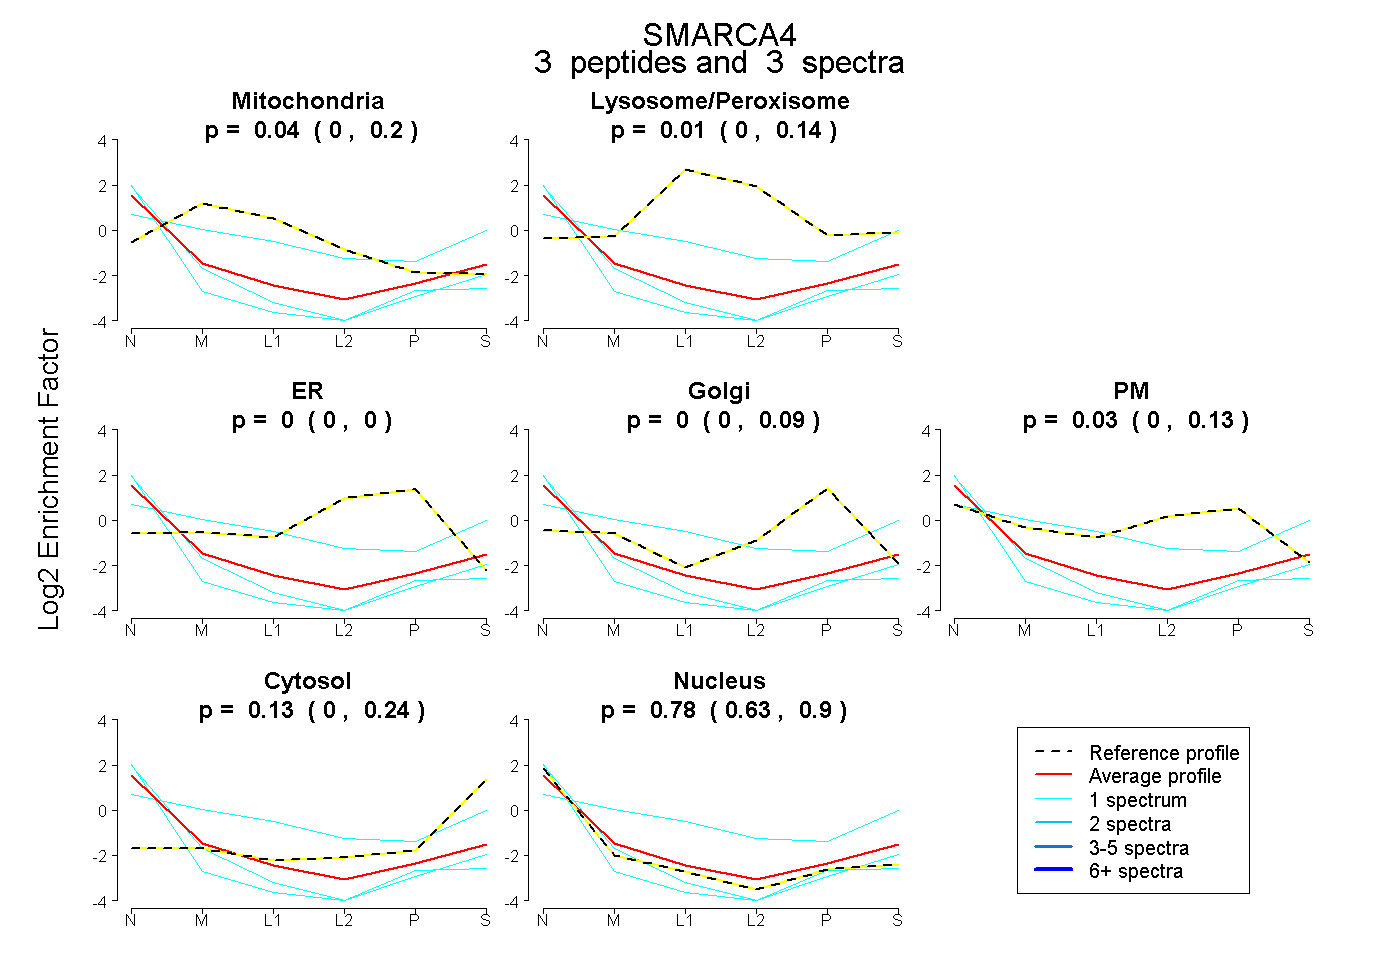
0.000 | 0.200
0.000 | 0.136
0.000 | 0.000
0.000 | 0.094
0.000 | 0.127
0.000 | 0.241
0.626 | 0.898