 12
12peptides
spectra
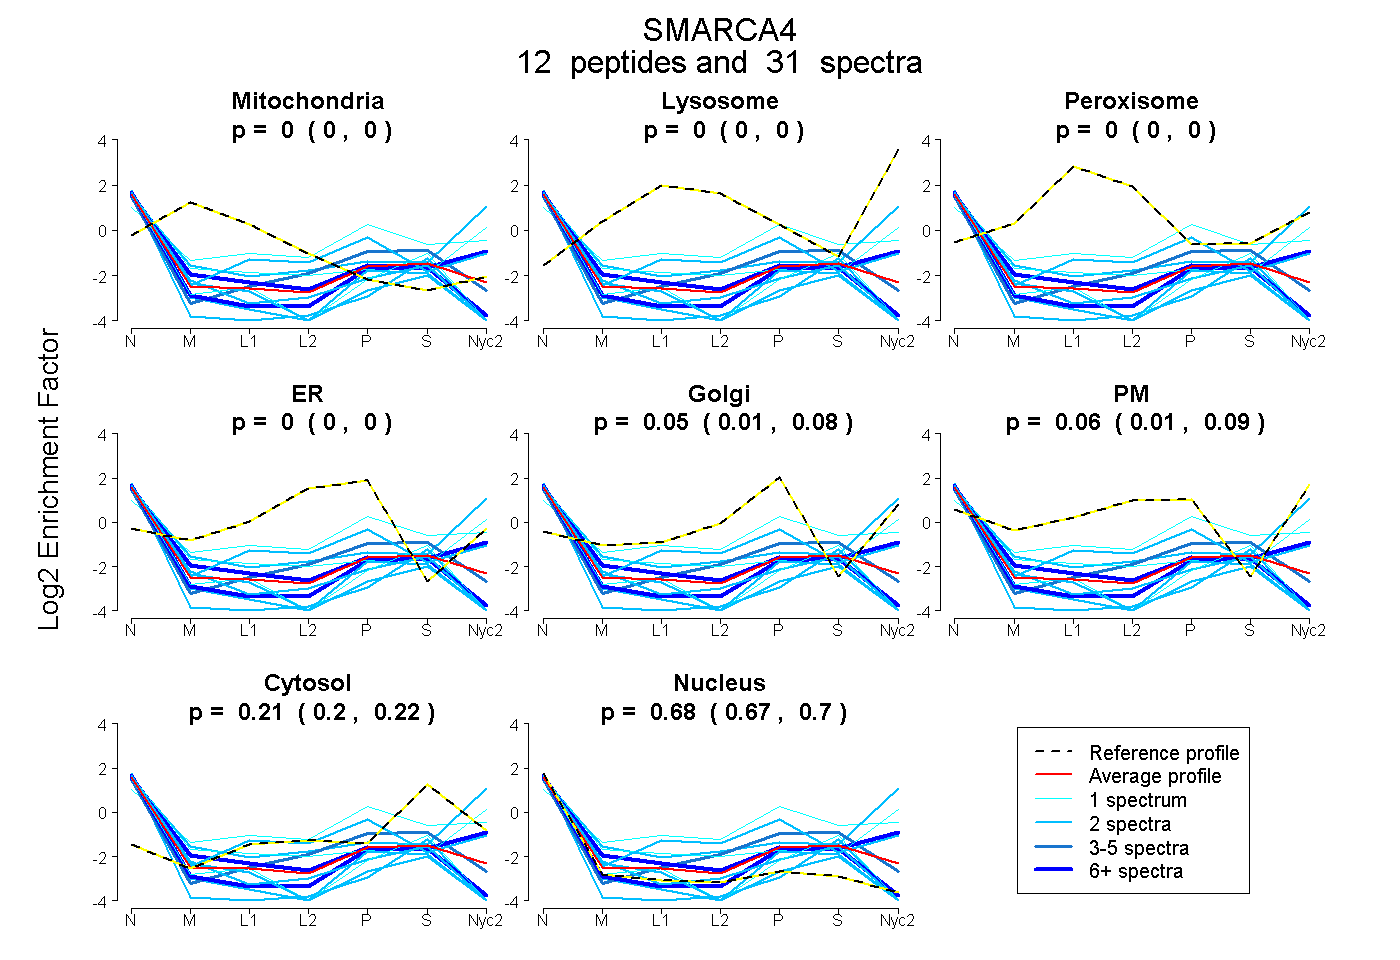
0.000 | 0.000
0.000 | 0.000
0.000 | 0.000
0.000 | 0.000
0.008 | 0.084
0.015 | 0.088
0.203 | 0.222
0.668 | 0.696
| Plot | Mito | Lyso | Perox | ER | Golgi | PM | Cytosol | Nucleus | |||||
| Expt A |
12 peptides |
31 spectra |
|
0.000 0.000 | 0.000 |
0.000 0.000 | 0.000 |
0.000 0.000 | 0.000 |
0.000 0.000 | 0.000 |
0.048 0.008 | 0.084 |
0.056 0.015 | 0.088 |
0.213 0.203 | 0.222 |
0.683 0.668 | 0.696 |
| 1 spectrum, LTQVLNTHYVAPR | 0.000 | 0.000 | 0.000 | 0.000 | 0.000 | 0.000 | 0.165 | 0.835 | ||
| 1 spectrum, AAQVAK | 0.000 | 0.000 | 0.000 | 0.000 | 0.125 | 0.350 | 0.313 | 0.211 | ||
| 2 spectra, GLDPVEILQER | 0.000 | 0.000 | 0.000 | 0.000 | 0.000 | 0.000 | 0.009 | 0.991 | ||
| 2 spectra, GPTPFNQNQLHQLR | 0.000 | 0.103 | 0.000 | 0.000 | 0.000 | 0.348 | 0.152 | 0.398 | ||
| 2 spectra, ITPIQKPR | 0.000 | 0.000 | 0.000 | 0.000 | 0.000 | 0.000 | 0.134 | 0.866 | ||
| 3 spectra, GRPPAEK | 0.000 | 0.000 | 0.000 | 0.102 | 0.000 | 0.000 | 0.313 | 0.585 | ||
| 2 spectra, WAPSVVK | 0.000 | 0.000 | 0.000 | 0.000 | 0.092 | 0.341 | 0.118 | 0.450 | ||
| 7 spectra, IGQQNEVR | 0.000 | 0.000 | 0.000 | 0.000 | 0.000 | 0.249 | 0.173 | 0.578 | ||
| 6 spectra, HEEEFDLFMR | 0.000 | 0.000 | 0.000 | 0.000 | 0.000 | 0.000 | 0.127 | 0.873 | ||
| 1 spectrum, ILNGAFR | 0.000 | 0.224 | 0.000 | 0.000 | 0.000 | 0.167 | 0.024 | 0.586 | ||
| 2 spectra, TLMNTIMQLR | 0.000 | 0.000 | 0.000 | 0.000 | 0.000 | 0.000 | 0.081 | 0.919 | ||
| 2 spectra, ELPEYYELIR | 0.000 | 0.000 | 0.000 | 0.000 | 0.000 | 0.000 | 0.064 | 0.936 |
| Plot | Mito | Lyso or Perox | ER | Golgi | PM | Cytosol | Nucleus | ||||||
| Expt B |
3 peptides |
3 spectra |
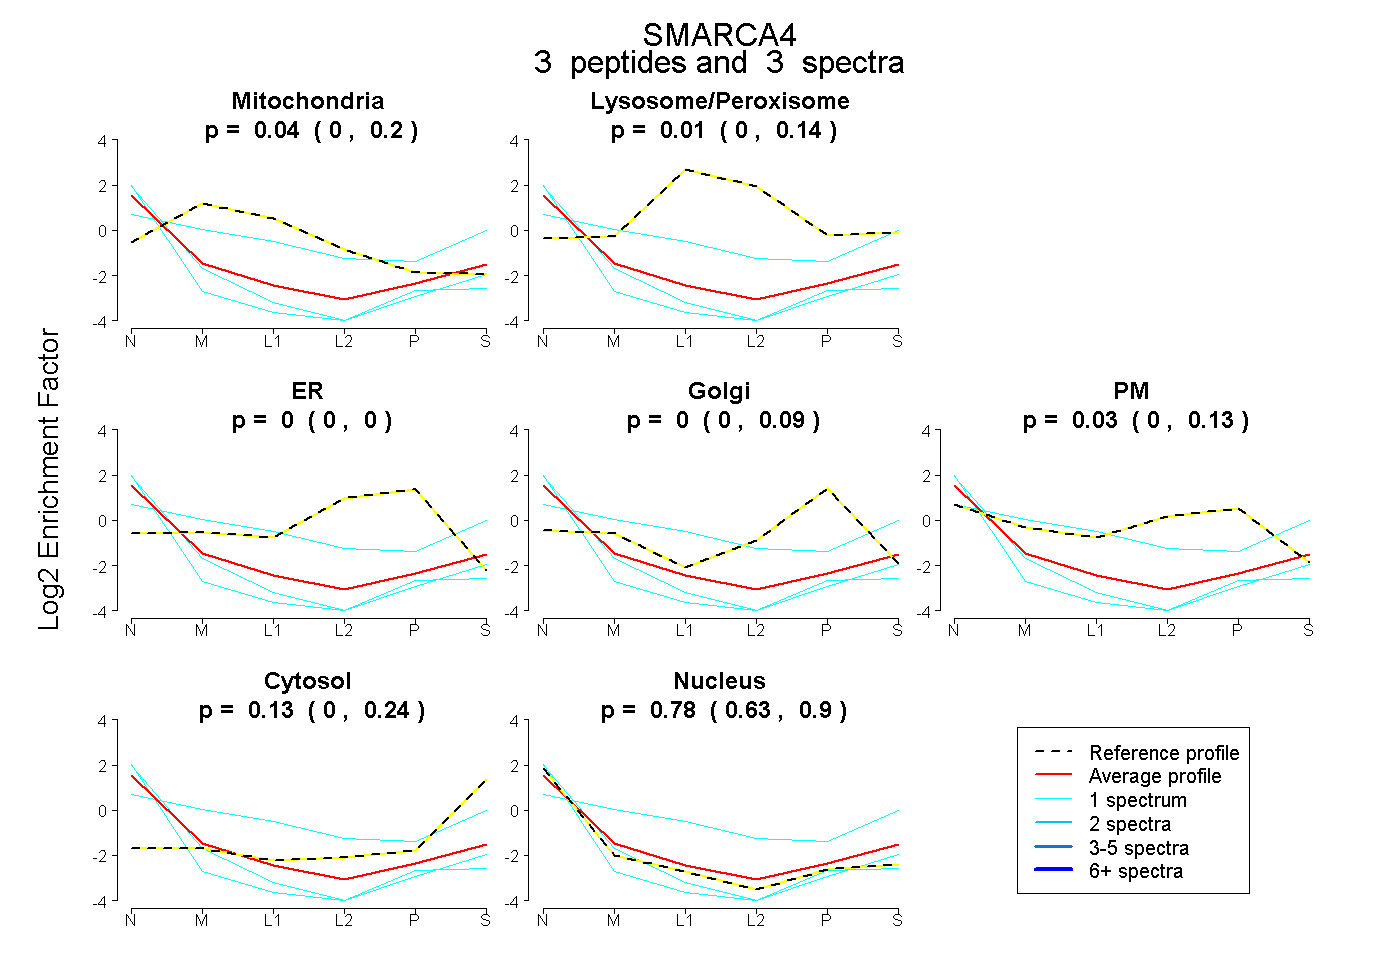 |
0.041 0.000 | 0.200 |
0.009 0.000 | 0.136 |
0.000 0.000 | 0.000 |
0.000 0.000 | 0.094 |
0.034 0.000 | 0.127 |
0.133 0.000 | 0.241 |
0.784 0.626 | 0.898 |