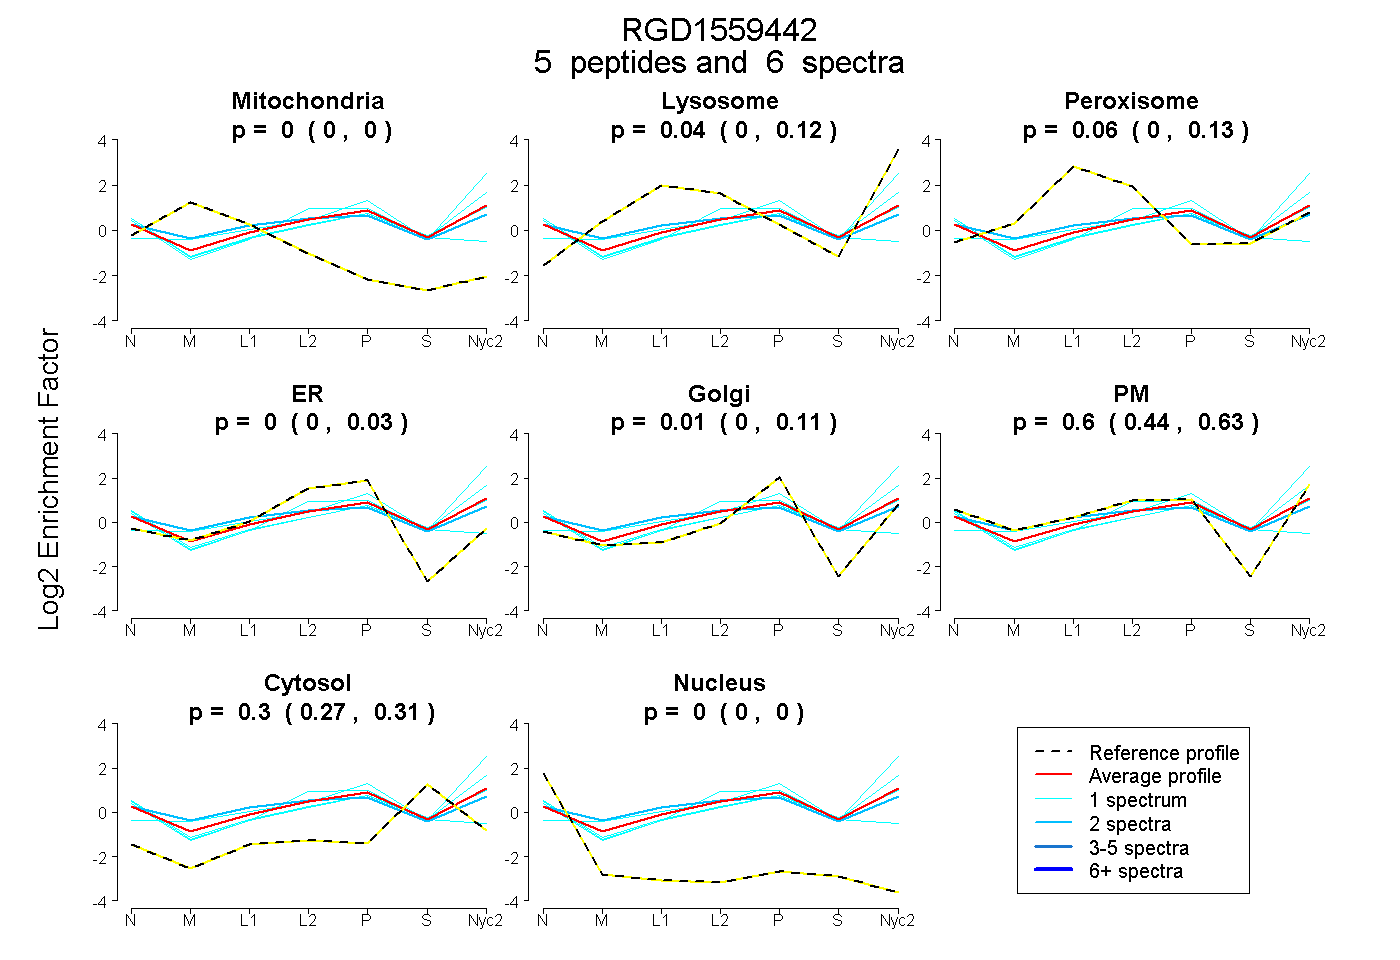
 5
5peptides
spectra
0.000 | 0.000
0.000 | 0.117
0.000 | 0.135
0.000 | 0.029
0.000 | 0.110
0.440 | 0.626
0.270 | 0.310
0.000 | 0.000
2peptides
spectra
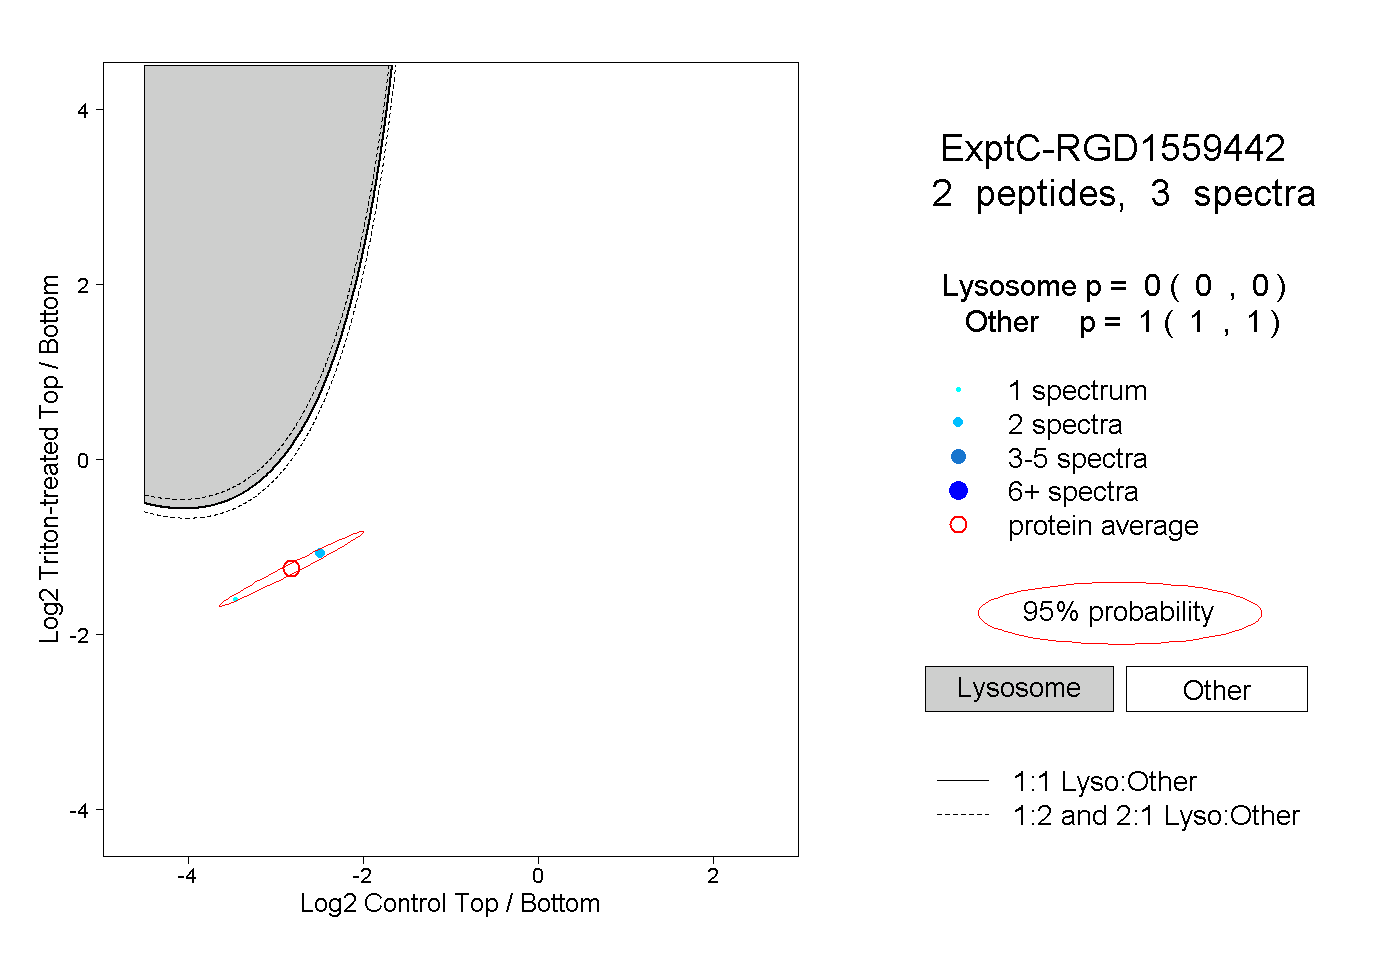
0.000 | 0.000
1.000 | 1.000
| Plot | Mito | Lyso | Perox | ER | Golgi | PM | Cytosol | Nucleus | |||||
| Expt A |
5 peptides |
6 spectra |
|
0.000 0.000 | 0.000 |
0.036 0.000 | 0.117 |
0.059 0.000 | 0.135 |
0.000 0.000 | 0.029 |
0.010 0.000 | 0.110 |
0.598 0.440 | 0.626 |
0.296 0.270 | 0.310 |
0.000 0.000 | 0.000 |
||
| Plot | Lyso | Other | |||||||||||
| Expt C |
2 peptides |
3 spectra |
|
0.000 0.000 | 0.000 |
1.000 1.000 | 1.000 |