 5
5peptides
spectra
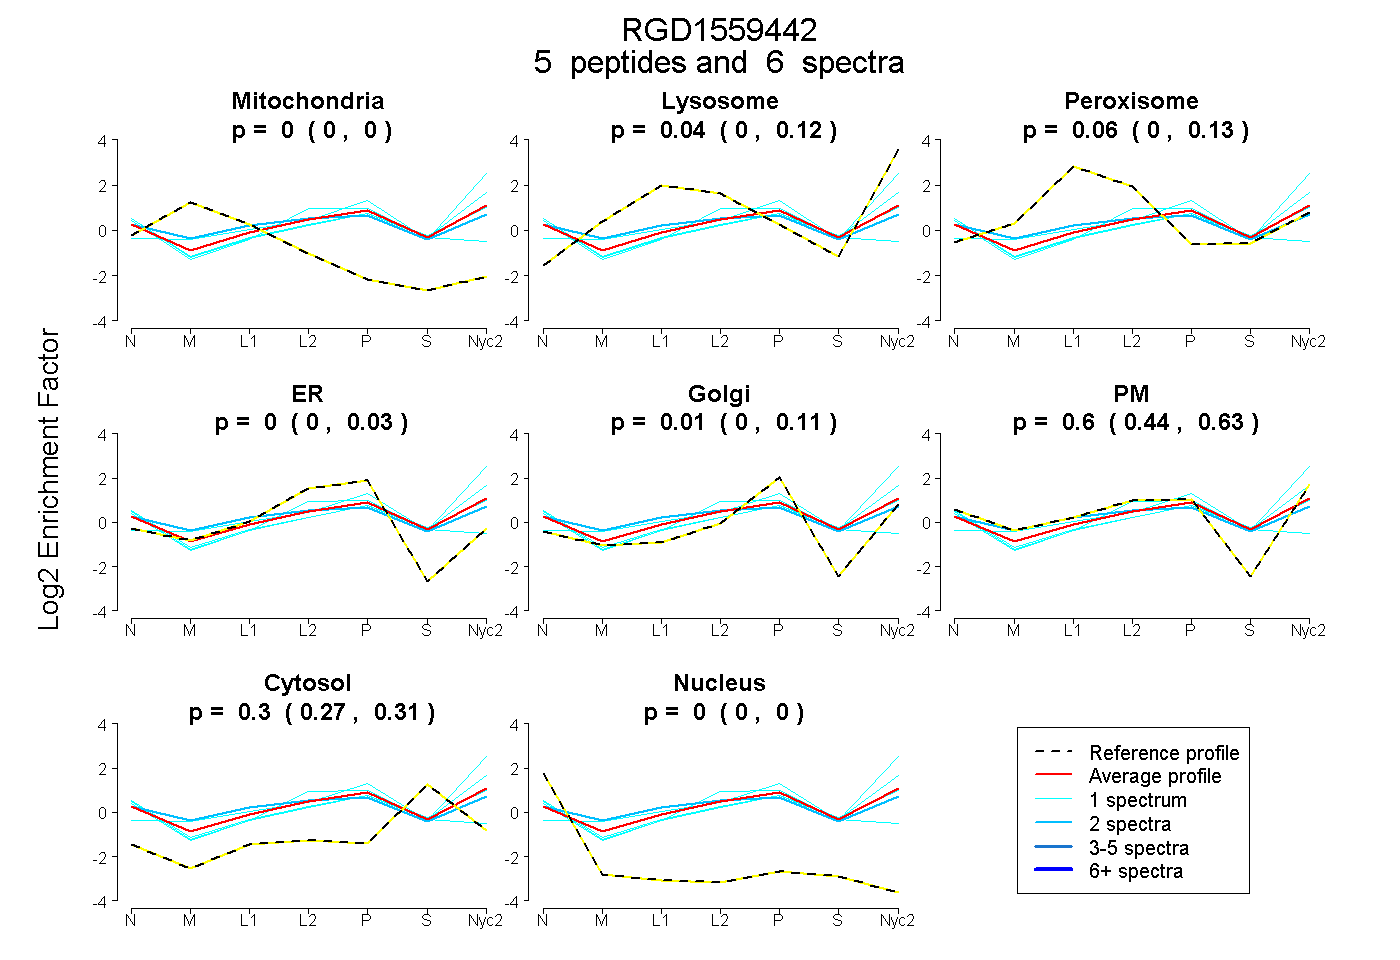
0.000 | 0.000
0.000 | 0.117
0.000 | 0.135
0.000 | 0.029
0.000 | 0.110
0.440 | 0.626
0.270 | 0.310
0.000 | 0.000
| Plot | Mito | Lyso | Perox | ER | Golgi | PM | Cytosol | Nucleus | |||||
| Expt A |
5 peptides |
6 spectra |
|
0.000 0.000 | 0.000 |
0.036 0.000 | 0.117 |
0.059 0.000 | 0.135 |
0.000 0.000 | 0.029 |
0.010 0.000 | 0.110 |
0.598 0.440 | 0.626 |
0.296 0.270 | 0.310 |
0.000 0.000 | 0.000 |
| 1 spectrum, LGLGTISGSSSR | 0.000 | 0.000 | 0.000 | 0.000 | 0.000 | 0.639 | 0.361 | 0.000 | ||
| 1 spectrum, ILRPALLPGEEIVCEGLR | 0.000 | 0.000 | 0.074 | 0.342 | 0.000 | 0.190 | 0.350 | 0.044 | ||
| 1 spectrum, GTPHDQLVGEQTVVR | 0.000 | 0.449 | 0.000 | 0.000 | 0.318 | 0.094 | 0.138 | 0.000 | ||
| 2 spectra, VITVFNSAQR | 0.000 | 0.000 | 0.230 | 0.000 | 0.067 | 0.458 | 0.244 | 0.000 | ||
| 1 spectrum, NQNATPATR | 0.000 | 0.089 | 0.000 | 0.000 | 0.000 | 0.639 | 0.272 | 0.000 |
| Plot | Lyso | Other | |||||||||||
| Expt C |
2 peptides |
3 spectra |
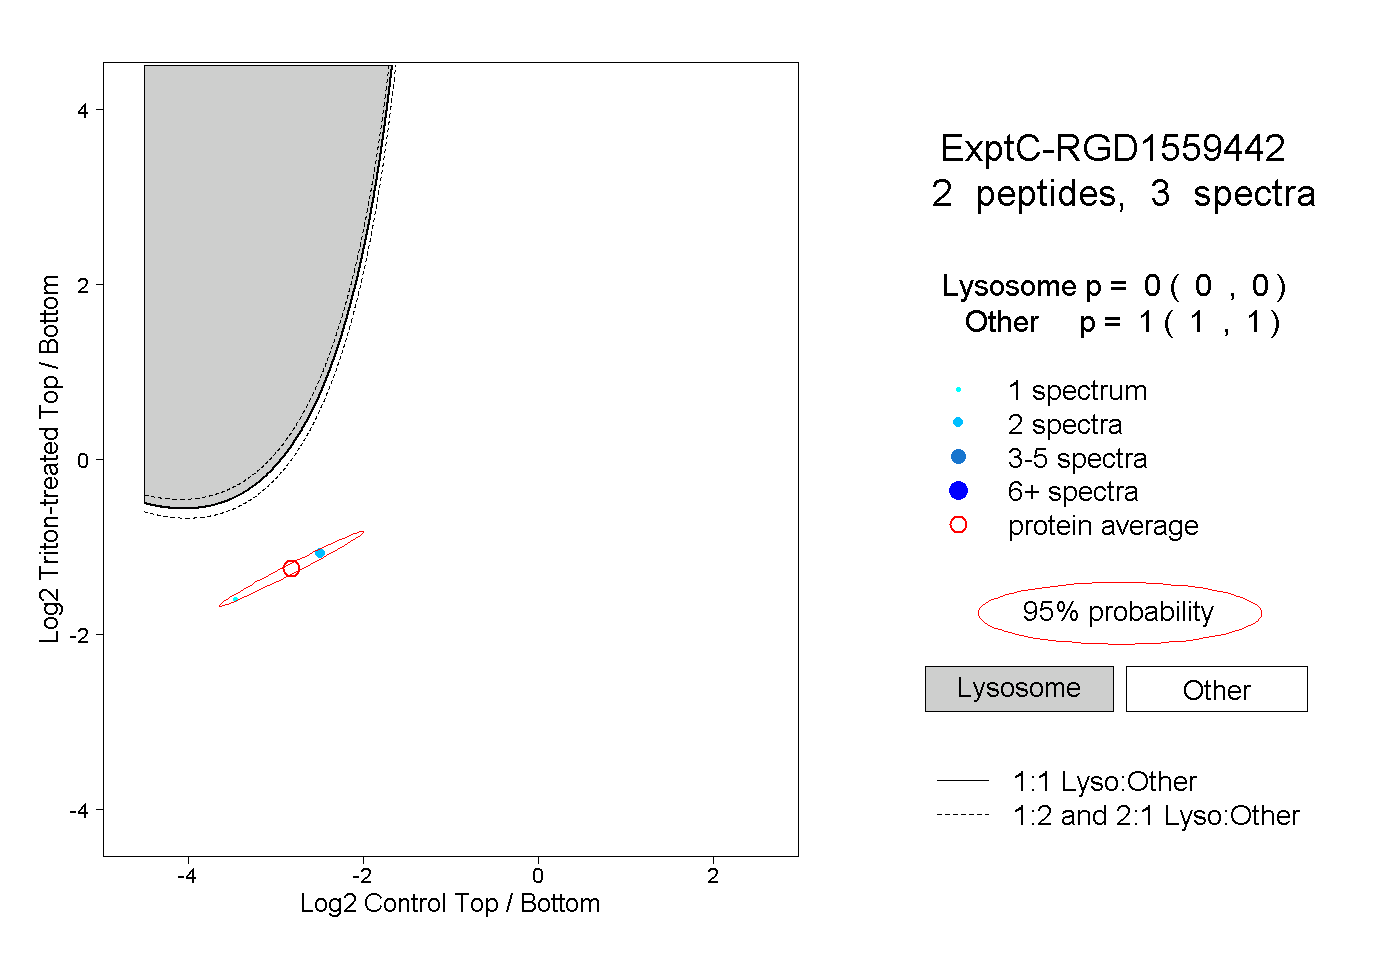 |
0.000 0.000 | 0.000 |
1.000 1.000 | 1.000 |