 13
13peptides
spectra
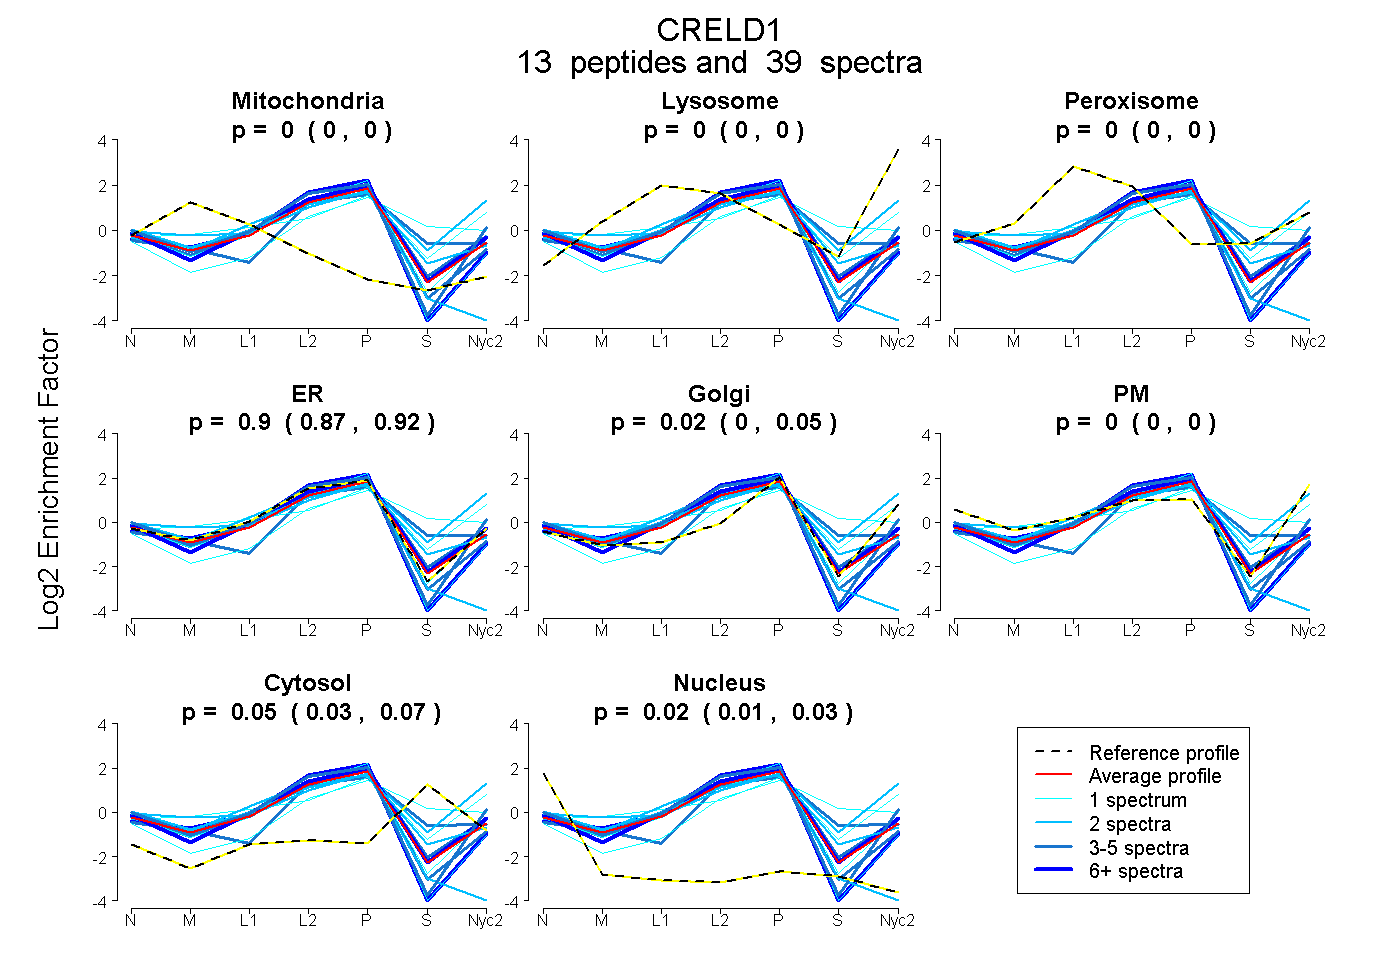
0.000 | 0.000
0.000 | 0.000
0.000 | 0.000
0.875 | 0.922
0.000 | 0.052
0.000 | 0.000
0.033 | 0.070
0.009 | 0.032
2peptides
spectra
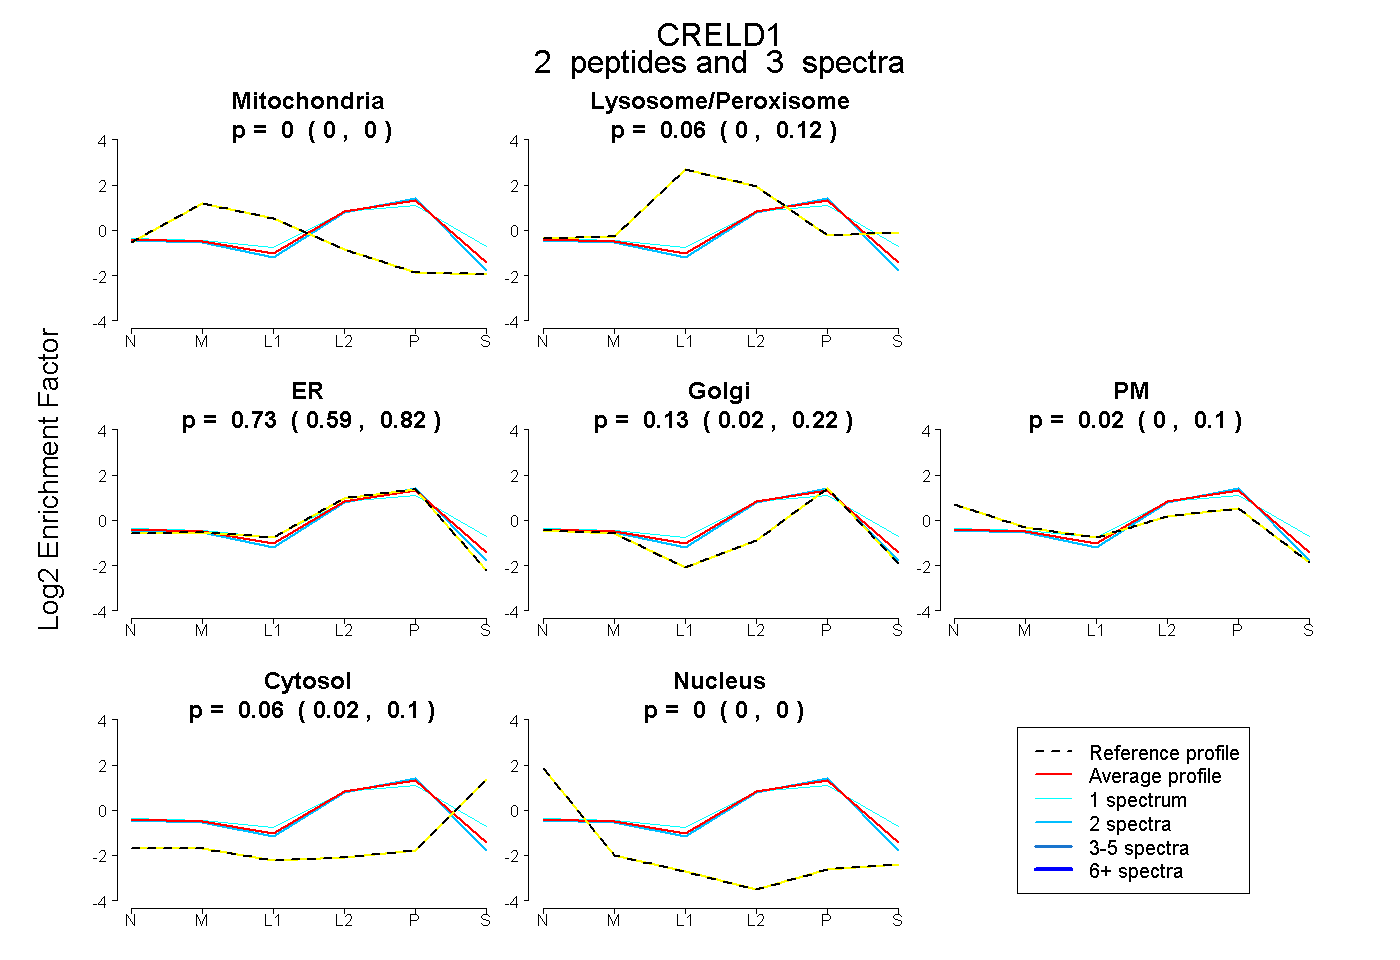
0.000 | 0.000
0.000 | 0.118
0.588 | 0.823
0.017 | 0.216
0.000 | 0.103
0.016 | 0.099
0.000 | 0.000
5peptides
spectra
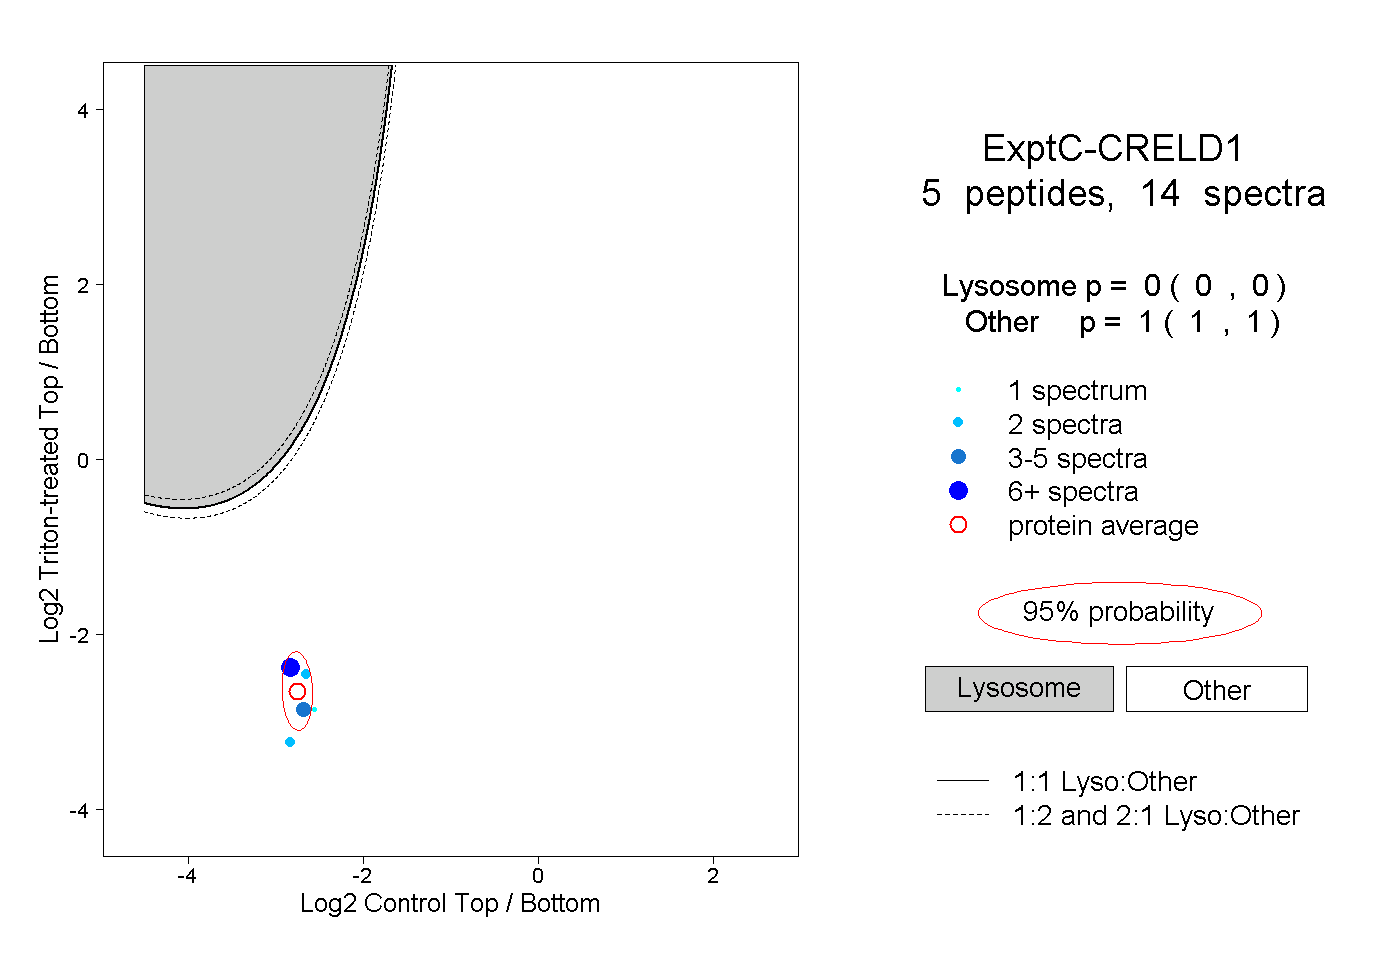
0.000 | 0.000
1.000 | 1.000
7peptides
spectra
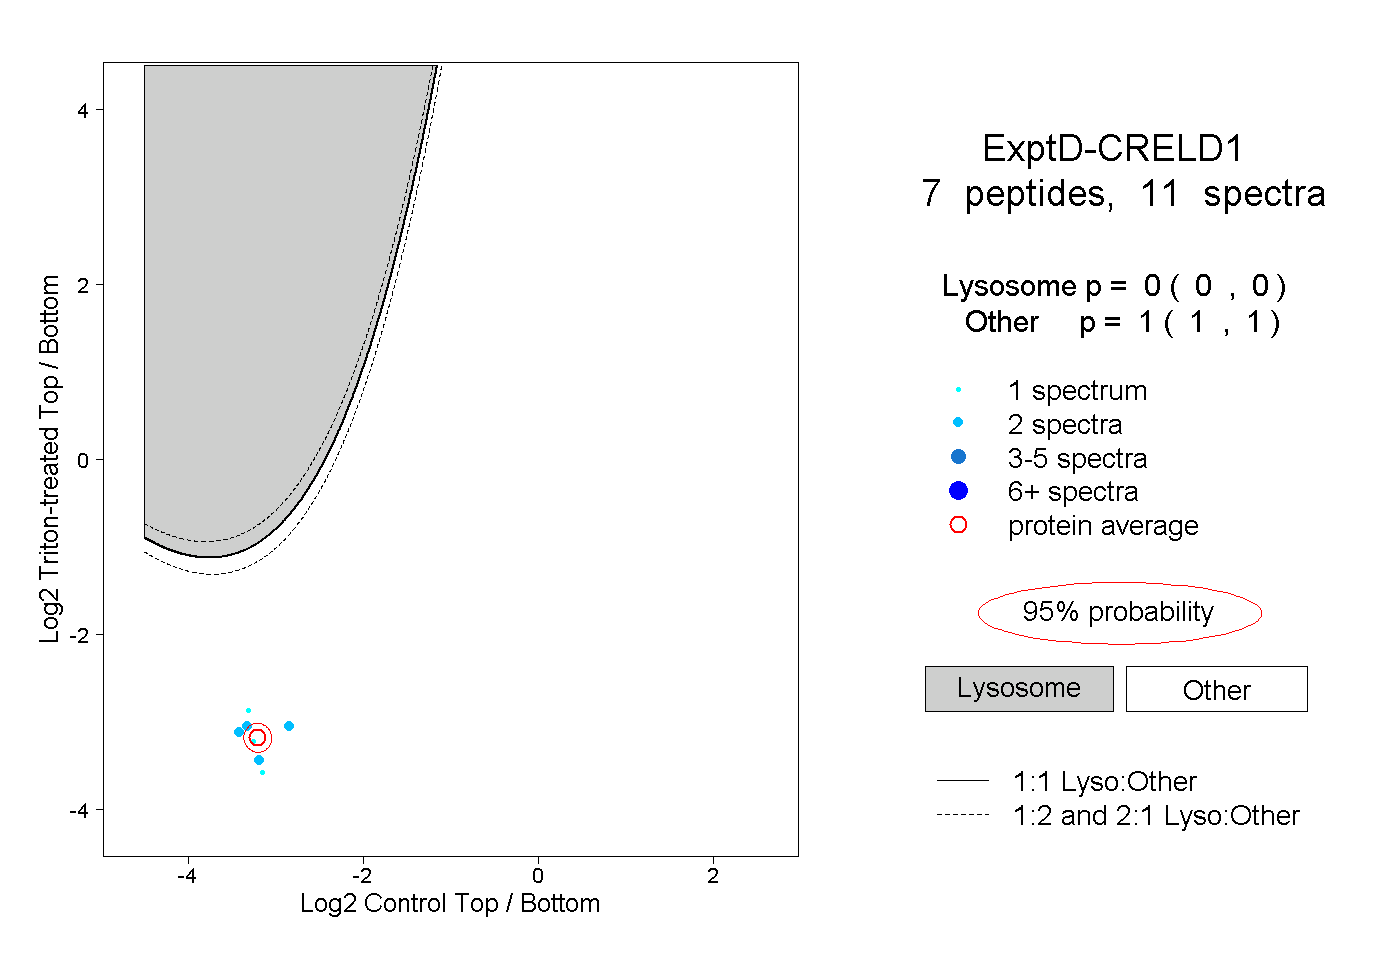
0.000 | 0.000
1.000 | 1.000