 13
13peptides
spectra
0.000 | 0.000
0.000 | 0.000
0.000 | 0.000
0.875 | 0.922
0.000 | 0.052
0.000 | 0.000
0.033 | 0.070
0.009 | 0.032
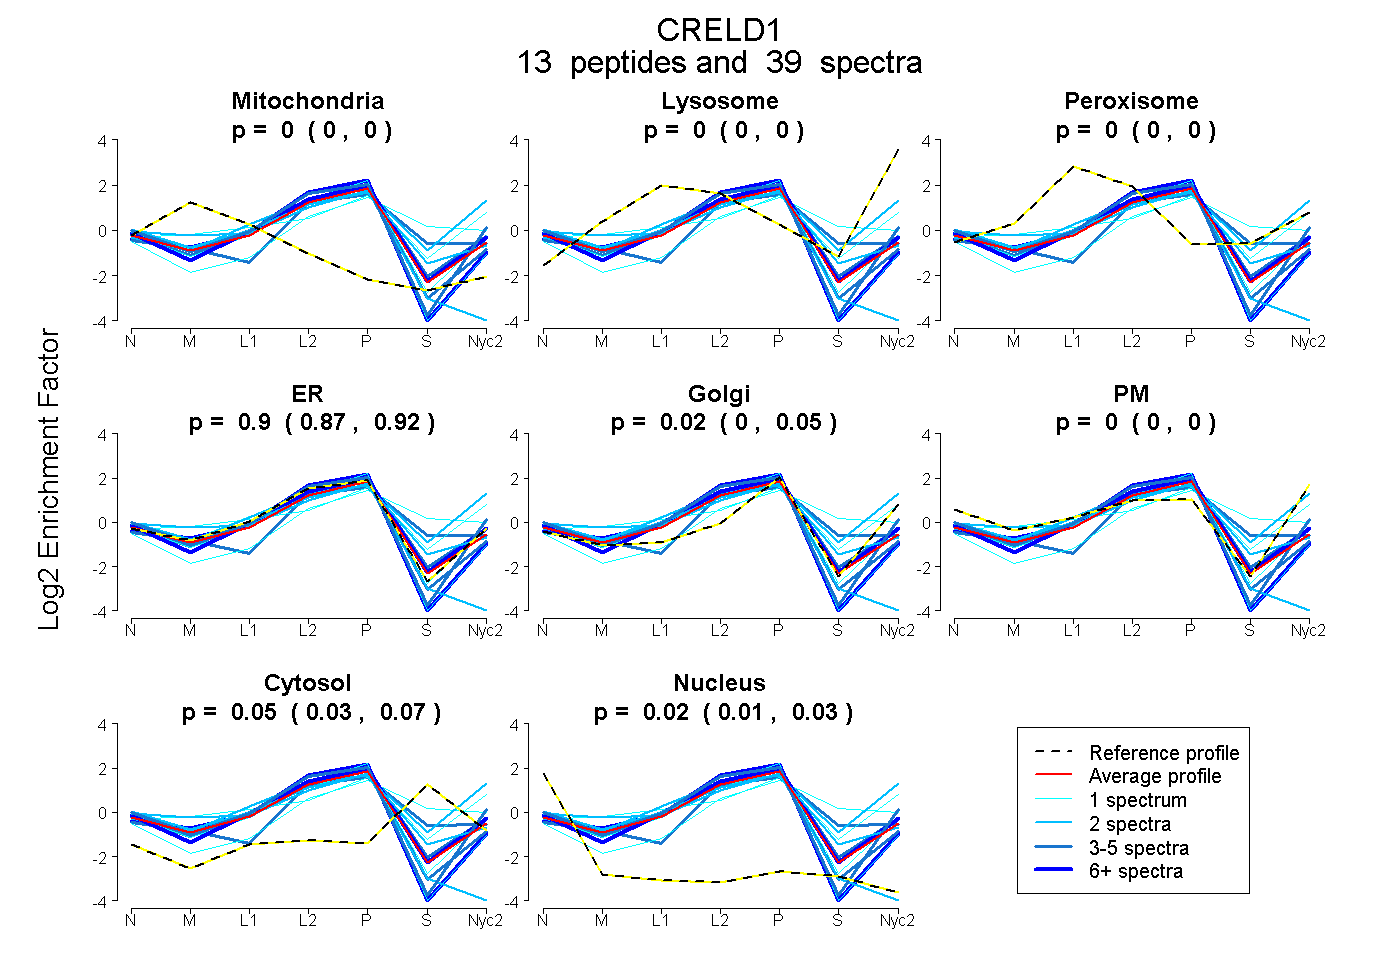
| Plot | Mito | Lyso | Perox | ER | Golgi | PM | Cytosol | Nucleus | |||||
| Expt A |
13 peptides |
39 spectra |
|
0.000 0.000 | 0.000 |
0.000 0.000 | 0.000 |
0.000 0.000 | 0.000 |
0.904 0.875 | 0.922 |
0.020 0.000 | 0.052 |
0.000 0.000 | 0.000 |
0.053 0.033 | 0.070 |
0.022 0.009 | 0.032 |
| 1 spectrum, DNFGGGNTAWEEEK | 0.000 | 0.000 | 0.000 | 0.942 | 0.000 | 0.000 | 0.000 | 0.058 | ||
| 1 spectrum, GYQQVGSK | 0.000 | 0.000 | 0.000 | 0.873 | 0.013 | 0.089 | 0.000 | 0.024 | ||
| 1 spectrum, GWALHHLK | 0.000 | 0.009 | 0.310 | 0.000 | 0.670 | 0.000 | 0.011 | 0.000 | ||
| 5 spectra, VLEGFIK | 0.000 | 0.000 | 0.000 | 0.899 | 0.000 | 0.101 | 0.000 | 0.000 | ||
| 2 spectra, LVEVLEGVCSK | 0.000 | 0.284 | 0.000 | 0.356 | 0.139 | 0.111 | 0.111 | 0.000 | ||
| 1 spectrum, CVCAEGFR | 0.000 | 0.000 | 0.000 | 0.348 | 0.224 | 0.000 | 0.428 | 0.000 | ||
| 3 spectra, ALVDSFNK | 0.000 | 0.000 | 0.000 | 0.874 | 0.045 | 0.000 | 0.081 | 0.000 | ||
| 2 spectra, QQEAPDLFQWLCSDSLK | 0.165 | 0.000 | 0.000 | 0.689 | 0.000 | 0.000 | 0.000 | 0.146 | ||
| 2 spectra, SDFECHR | 0.000 | 0.000 | 0.047 | 0.806 | 0.000 | 0.000 | 0.147 | 0.000 | ||
| 6 spectra, QEDGICVK | 0.000 | 0.000 | 0.000 | 0.904 | 0.038 | 0.000 | 0.058 | 0.000 | ||
| 4 spectra, AEPHPCHTCR | 0.000 | 0.000 | 0.000 | 0.942 | 0.000 | 0.000 | 0.000 | 0.058 | ||
| 4 spectra, CTGPEESHCLQCR | 0.000 | 0.000 | 0.000 | 0.677 | 0.020 | 0.000 | 0.302 | 0.000 | ||
| 7 spectra, ACLGCMGAGPGR | 0.000 | 0.000 | 0.000 | 0.988 | 0.000 | 0.000 | 0.000 | 0.012 |
| Plot | Mito | Lyso or Perox | ER | Golgi | PM | Cytosol | Nucleus | ||||||
| Expt B |
2 peptides |
3 spectra |
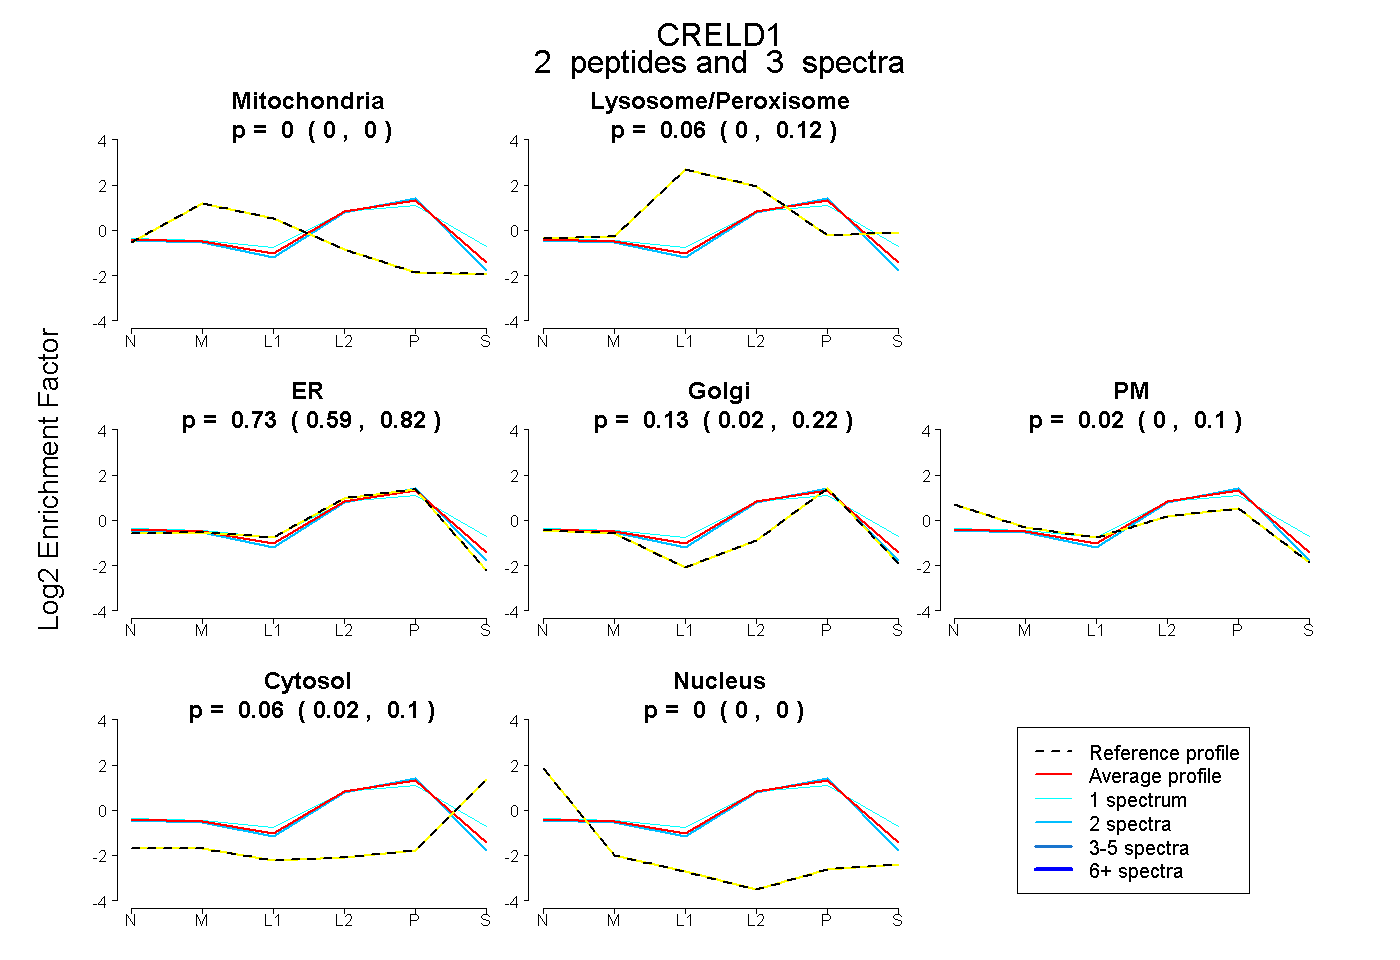 |
0.000 0.000 | 0.000 |
0.058 0.000 | 0.118 |
0.728 0.588 | 0.823 |
0.130 0.017 | 0.216 |
0.022 0.000 | 0.103 |
0.062 0.016 | 0.099 |
0.000 0.000 | 0.000 |
|||
| Plot | Lyso | Other | |||||||||||
| Expt C |
5 peptides |
14 spectra |
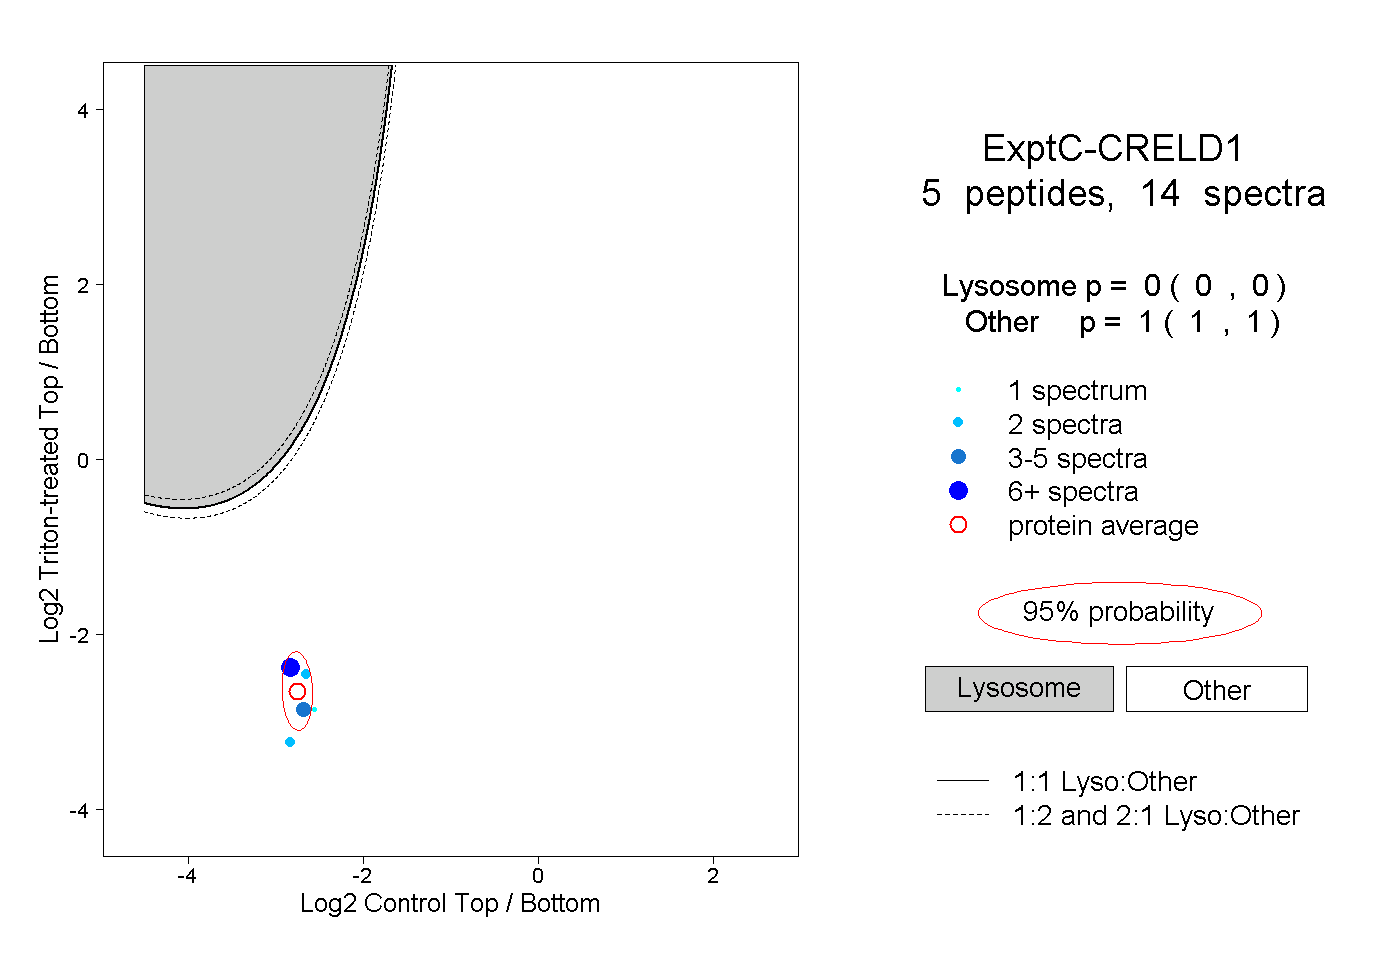 |
0.000 0.000 | 0.000 |
1.000 1.000 | 1.000 |
||||||||
| Plot | Lyso | Other | |||||||||||
| Expt D |
7 peptides |
11 spectra |
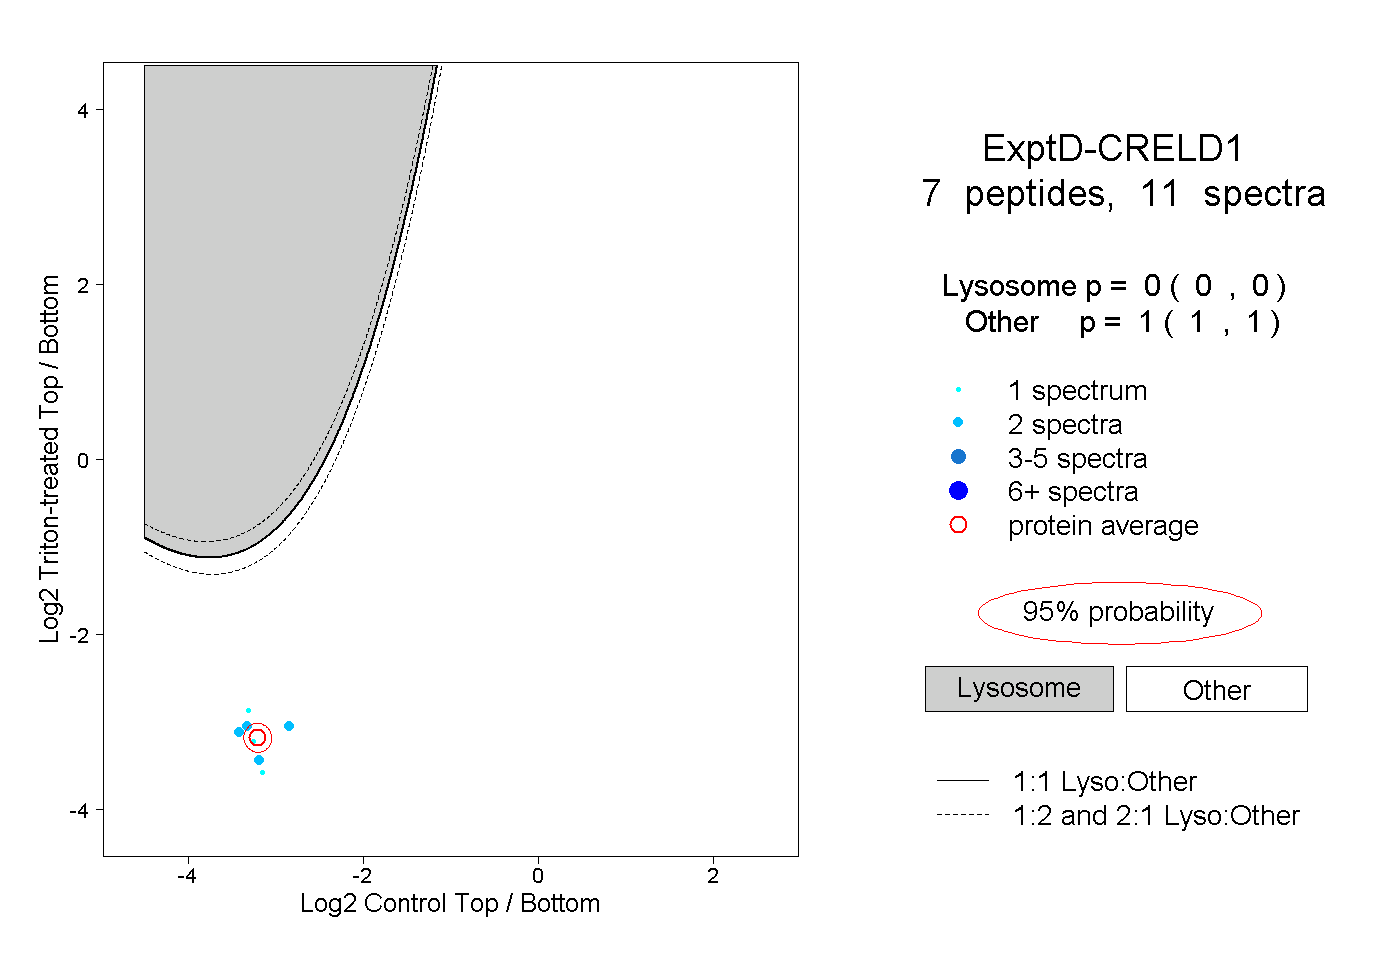 |
0.000 0.000 | 0.000 |
1.000 1.000 | 1.000 |