 8
8peptides
spectra
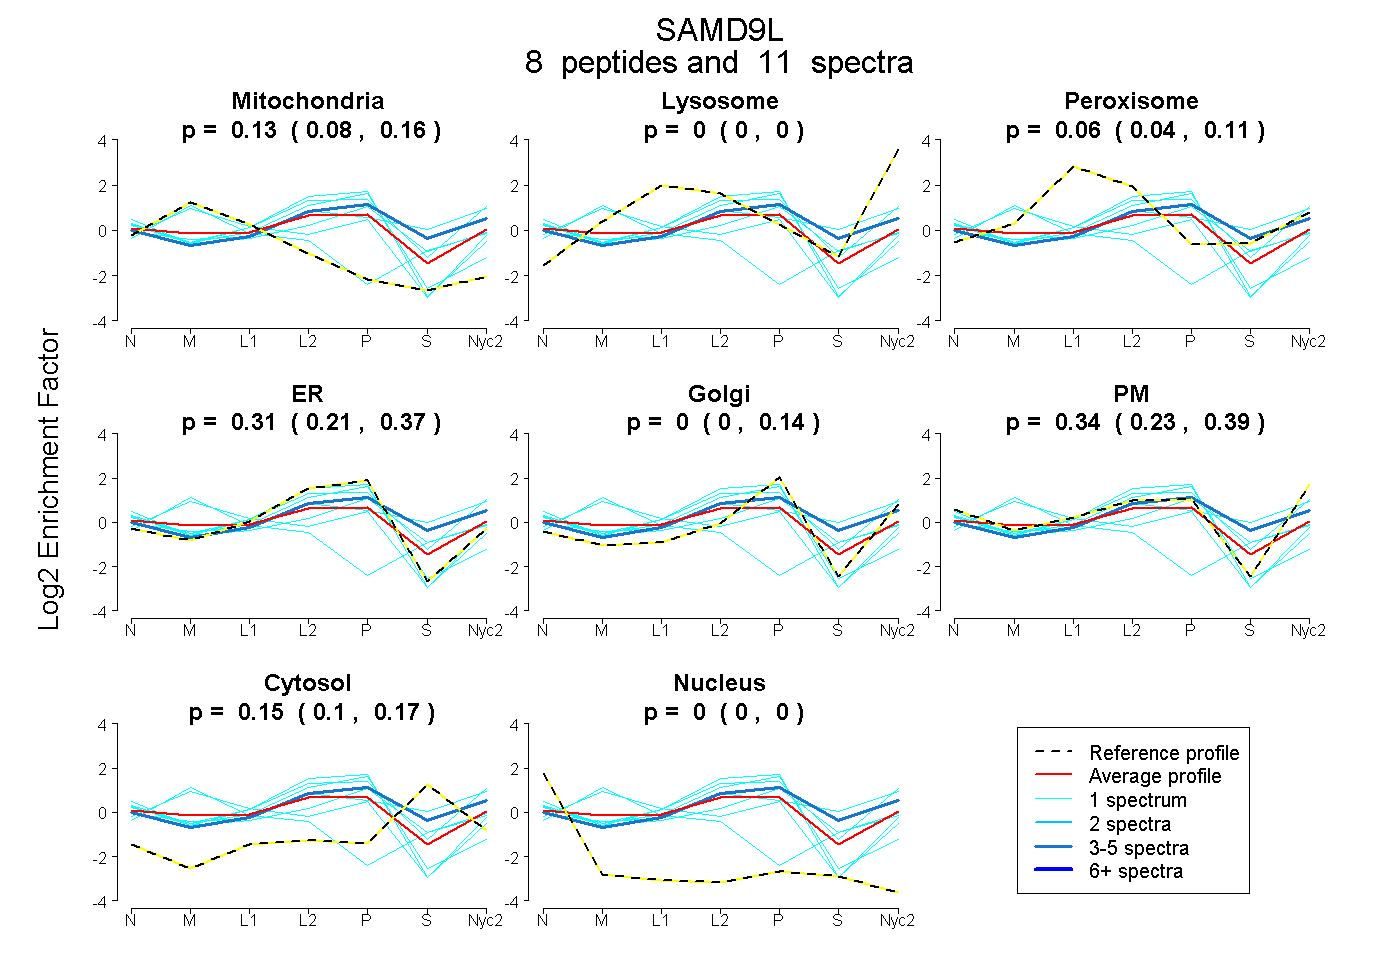
0.084 | 0.164
0.000 | 0.000
0.038 | 0.109
0.209 | 0.367
0.000 | 0.136
0.229 | 0.389
0.096 | 0.175
0.000 | 0.000
5peptides
spectra
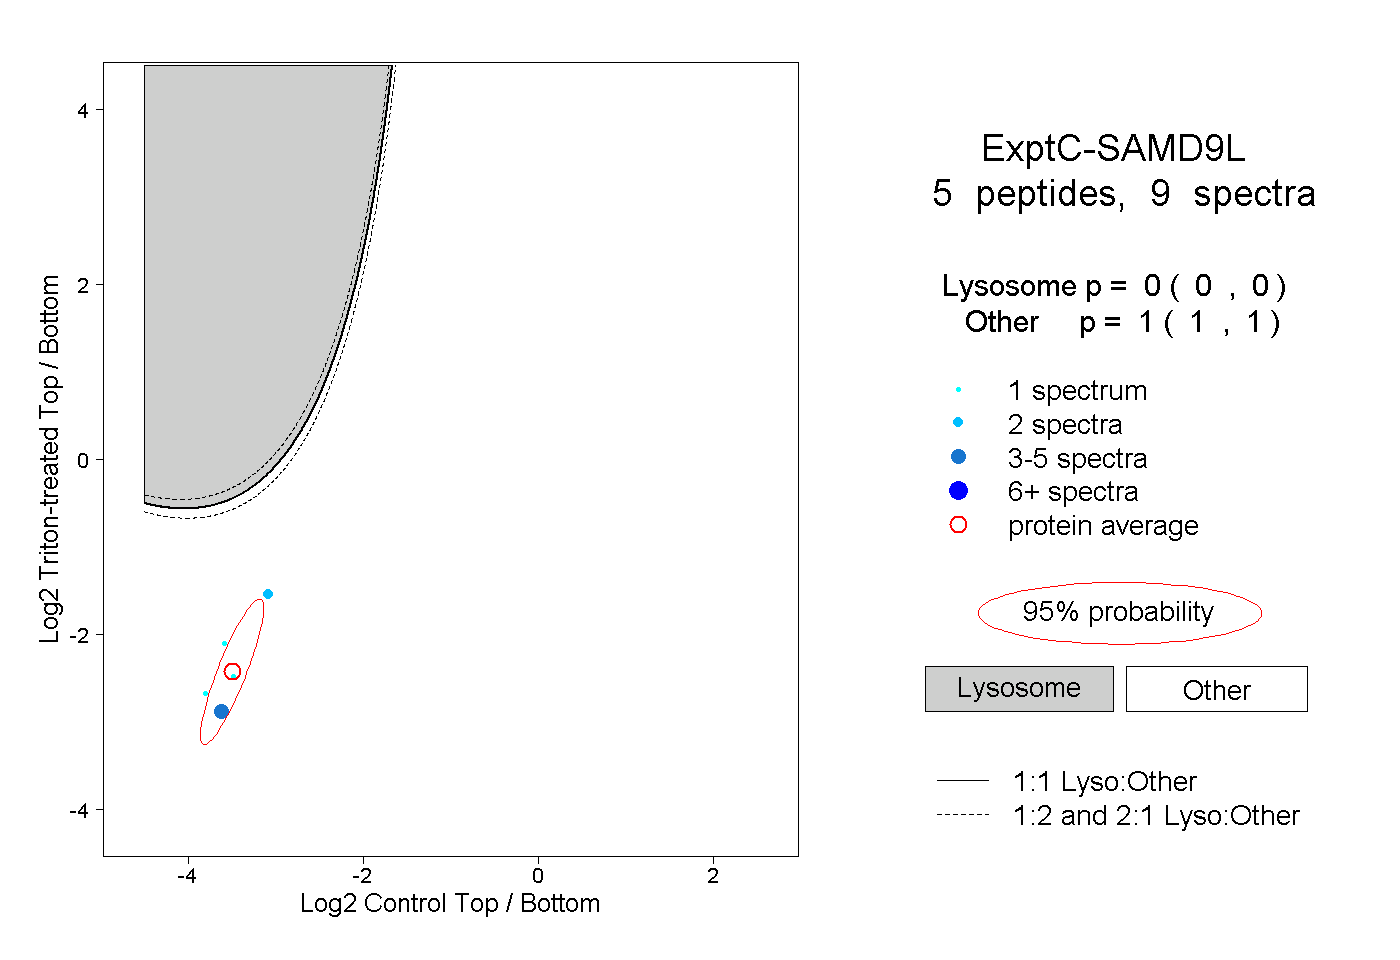
0.000 | 0.000
1.000 | 1.000
2peptides
spectra
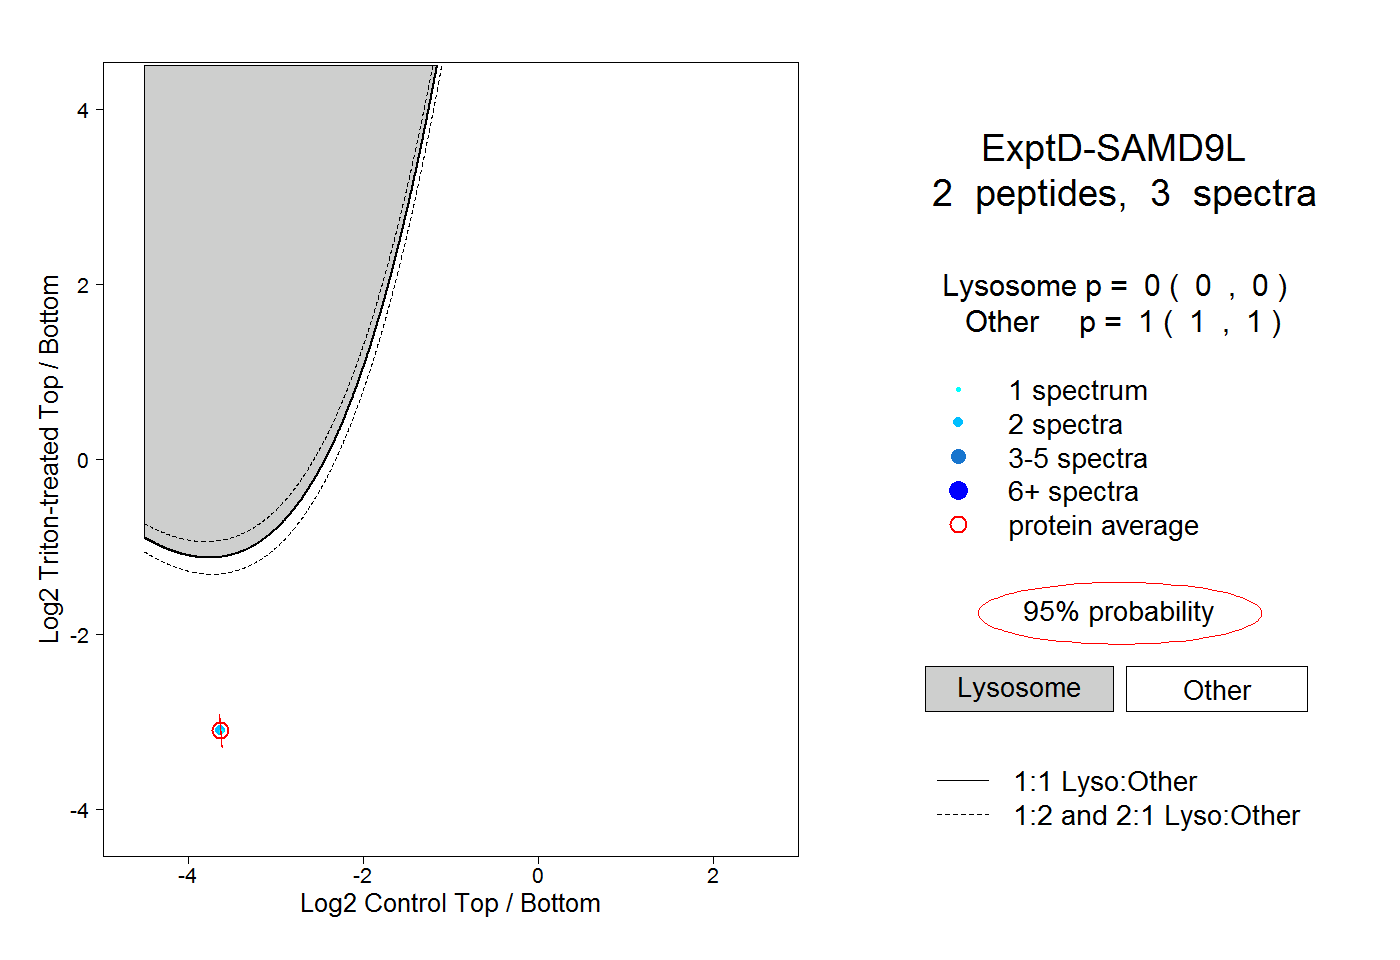
0.000 | 0.000
1.000 | 1.000