 8
8peptides
spectra
0.084 | 0.164
0.000 | 0.000
0.038 | 0.109
0.209 | 0.367
0.000 | 0.136
0.229 | 0.389
0.096 | 0.175
0.000 | 0.000
| Plot | Mito | Lyso | Perox | ER | Golgi | PM | Cytosol | Nucleus | |||||
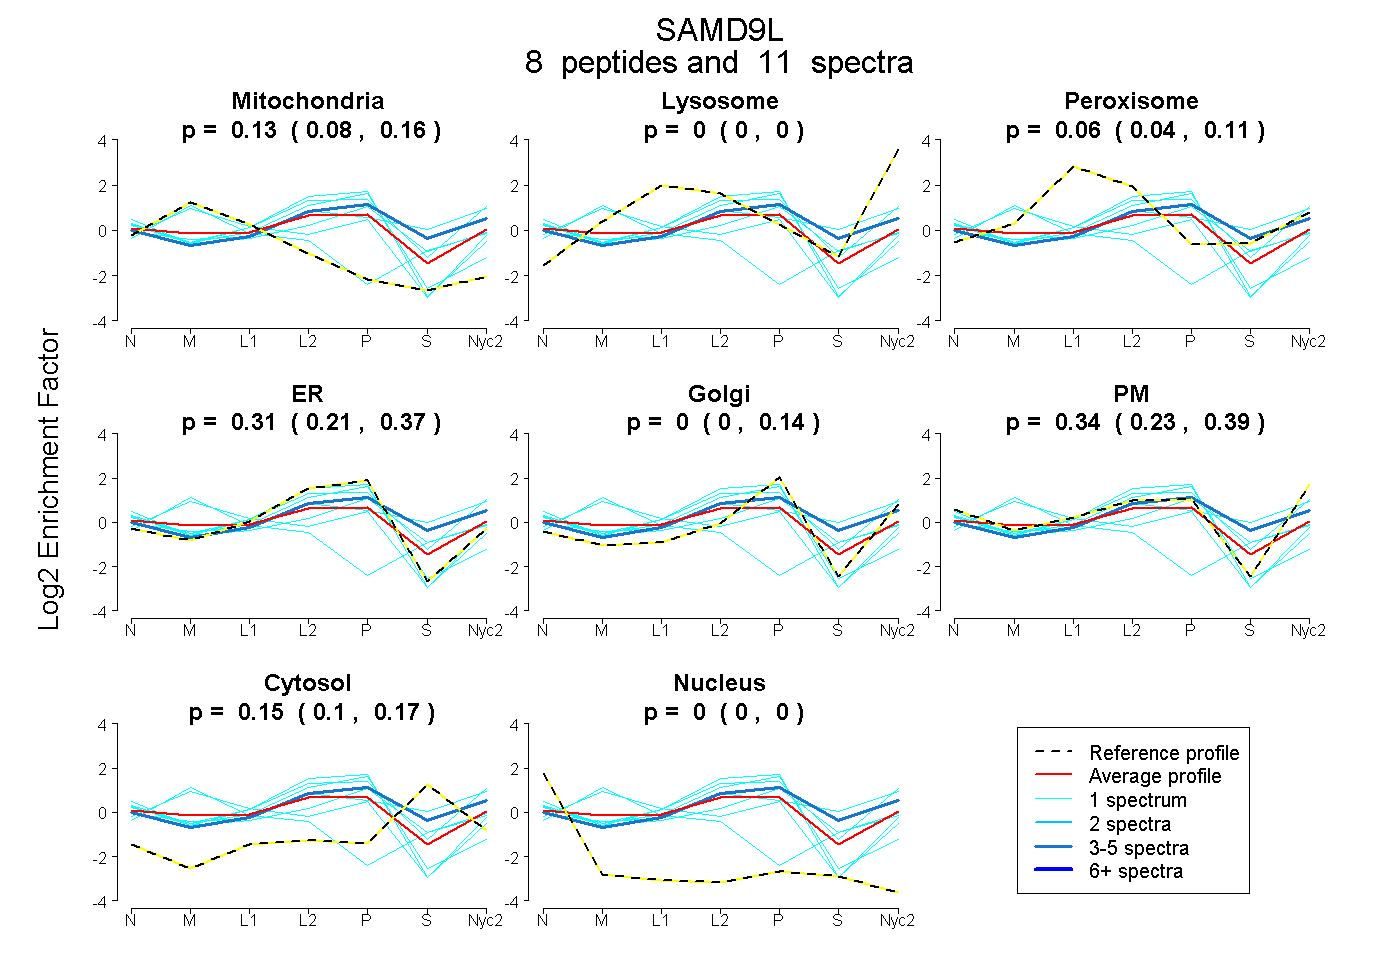
| Expt A |
8 peptides |
11 spectra |
|
0.127 0.084 | 0.164 |
0.000 0.000 | 0.000 |
0.064 0.038 | 0.109 |
0.312 0.209 | 0.367 |
0.003 0.000 | 0.136 |
0.345 0.229 | 0.389 |
0.149 0.096 | 0.175 |
0.000 0.000 | 0.000 |
| 4 spectra, TEVSDYGR | 0.000 | 0.010 | 0.129 | 0.196 | 0.102 | 0.309 | 0.255 | 0.000 | ||
| 1 spectrum, FAAACMNTR | 0.057 | 0.000 | 0.000 | 0.922 | 0.000 | 0.017 | 0.000 | 0.004 | ||
| 1 spectrum, AFTNTETATQEQMK | 0.426 | 0.020 | 0.000 | 0.109 | 0.210 | 0.234 | 0.000 | 0.000 | ||
| 1 spectrum, AAEECMVVSK | 0.022 | 0.000 | 0.019 | 0.275 | 0.062 | 0.352 | 0.244 | 0.027 | ||
| 1 spectrum, FSNETFR | 0.000 | 0.065 | 0.060 | 0.271 | 0.000 | 0.498 | 0.106 | 0.000 | ||
| 1 spectrum, HDVQTLLLTR | 0.000 | 0.086 | 0.126 | 0.004 | 0.000 | 0.463 | 0.320 | 0.000 | ||
| 1 spectrum, FVEVLLLNNTQSNR | 0.601 | 0.210 | 0.000 | 0.000 | 0.000 | 0.000 | 0.189 | 0.000 | ||
| 1 spectrum, IIHPLIAIHCLK | 0.070 | 0.000 | 0.000 | 0.855 | 0.000 | 0.000 | 0.000 | 0.075 |
| Plot | Lyso | Other | |||||||||||
| Expt C |
5 peptides |
9 spectra |
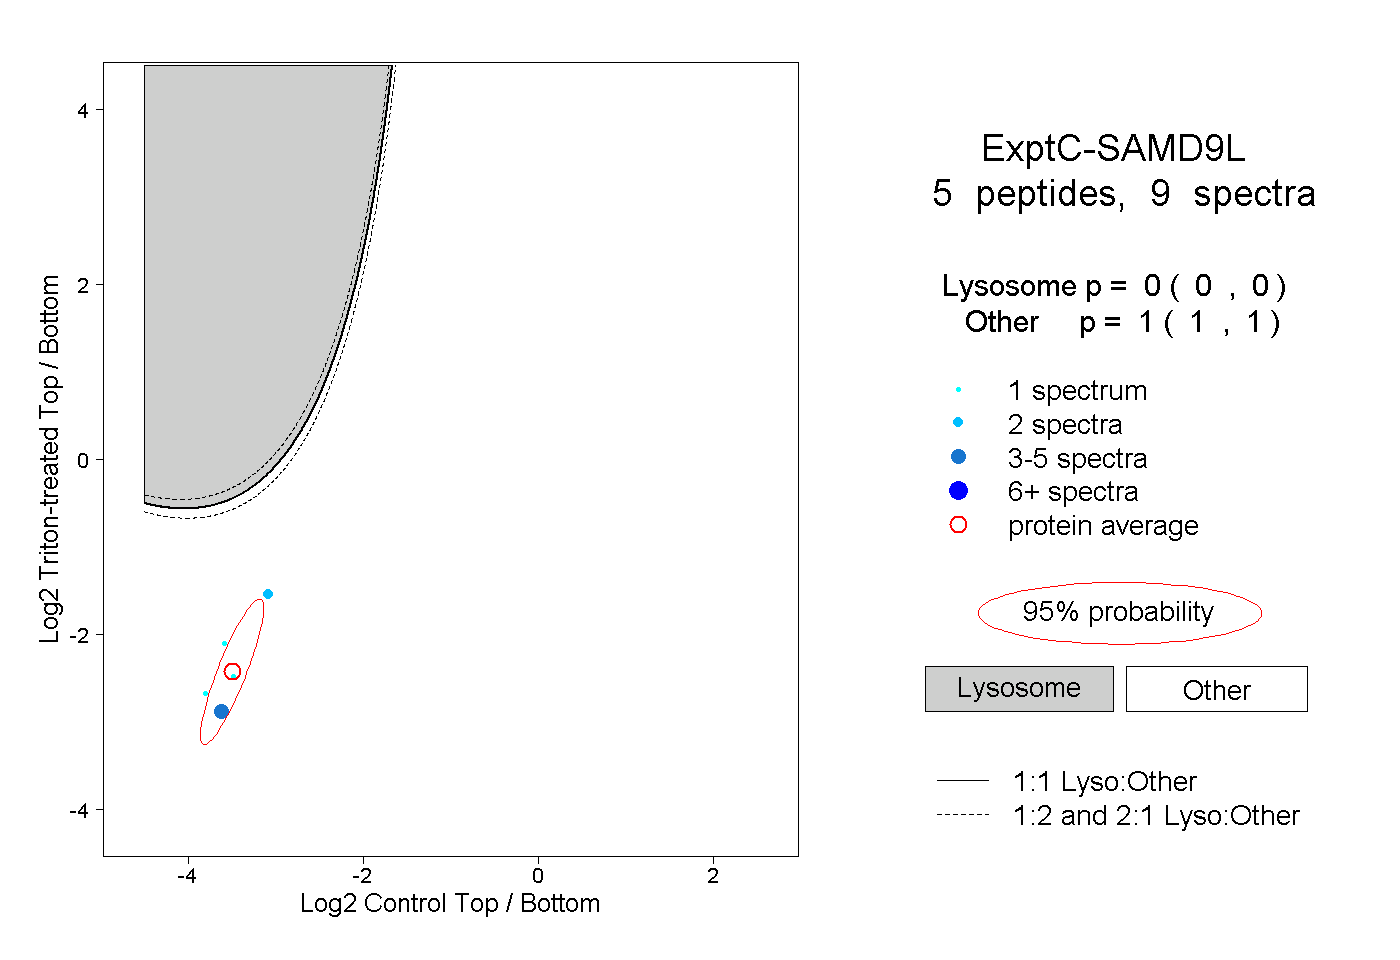 |
0.000 0.000 | 0.000 |
1.000 1.000 | 1.000 |
||||||||
| Plot | Lyso | Other | |||||||||||
| Expt D |
2 peptides |
3 spectra |
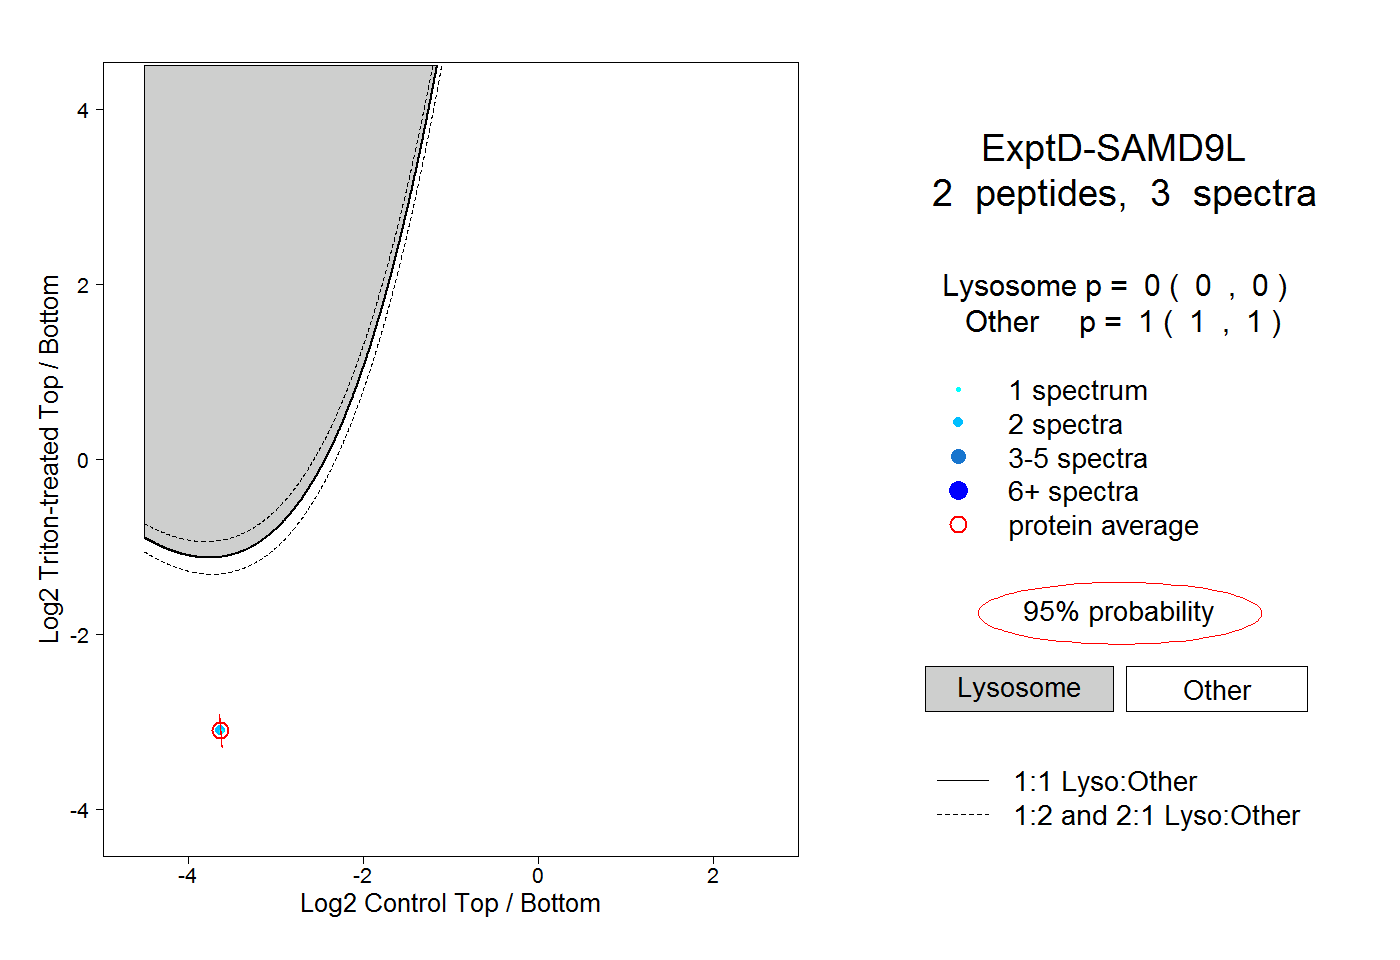 |
0.000 0.000 | 0.000 |
1.000 1.000 | 1.000 |