 2
2peptides
spectra
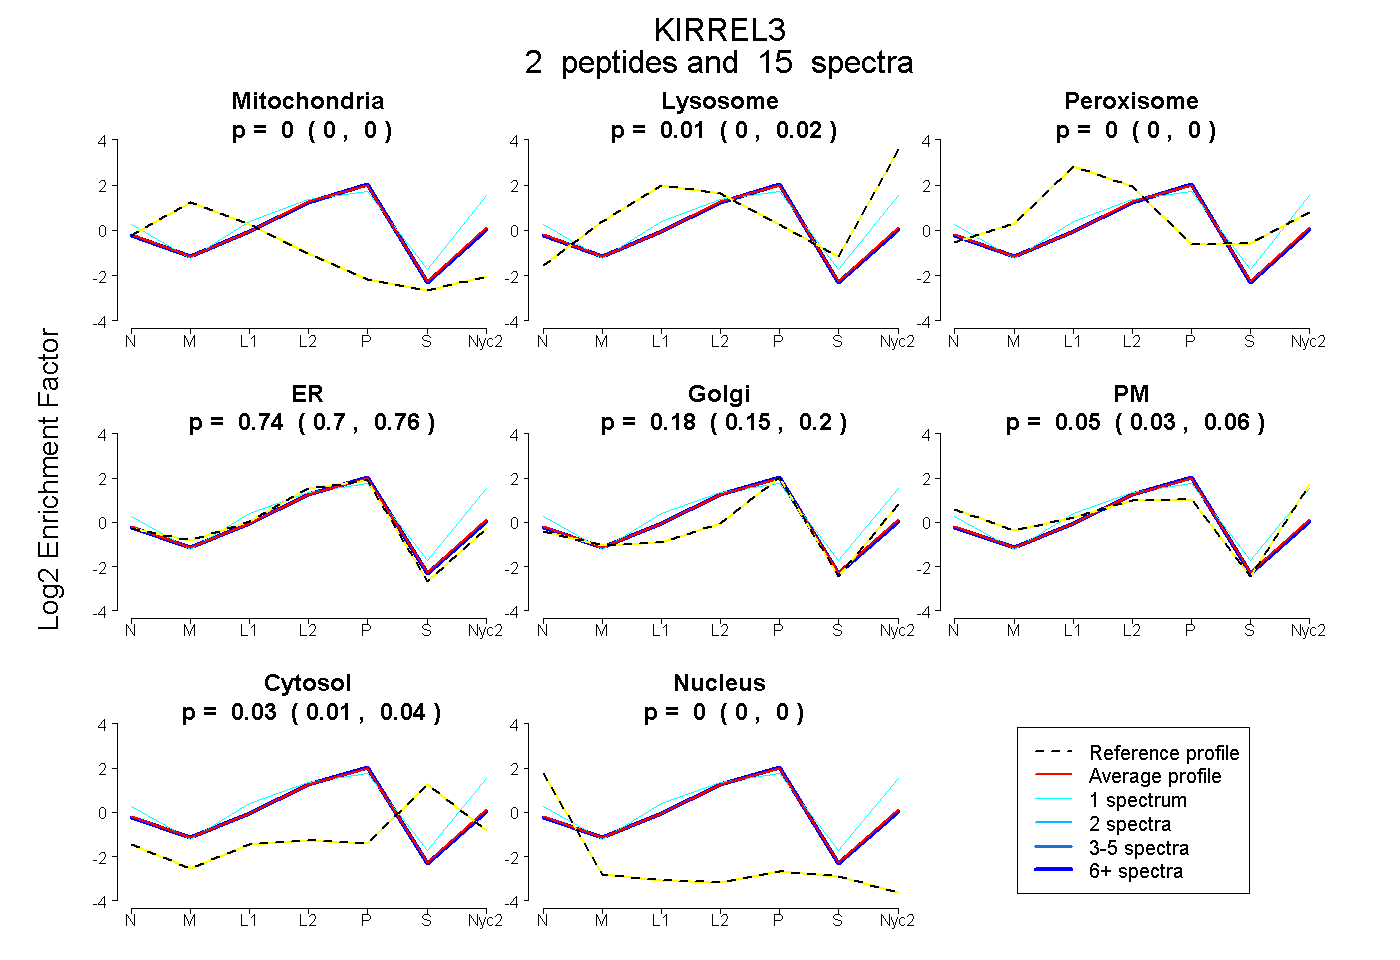
0.000 | 0.000
0.000 | 0.025
0.000 | 0.000
0.703 | 0.759
0.154 | 0.202
0.028 | 0.062
0.008 | 0.039
0.000 | 0.000
2peptides
spectra
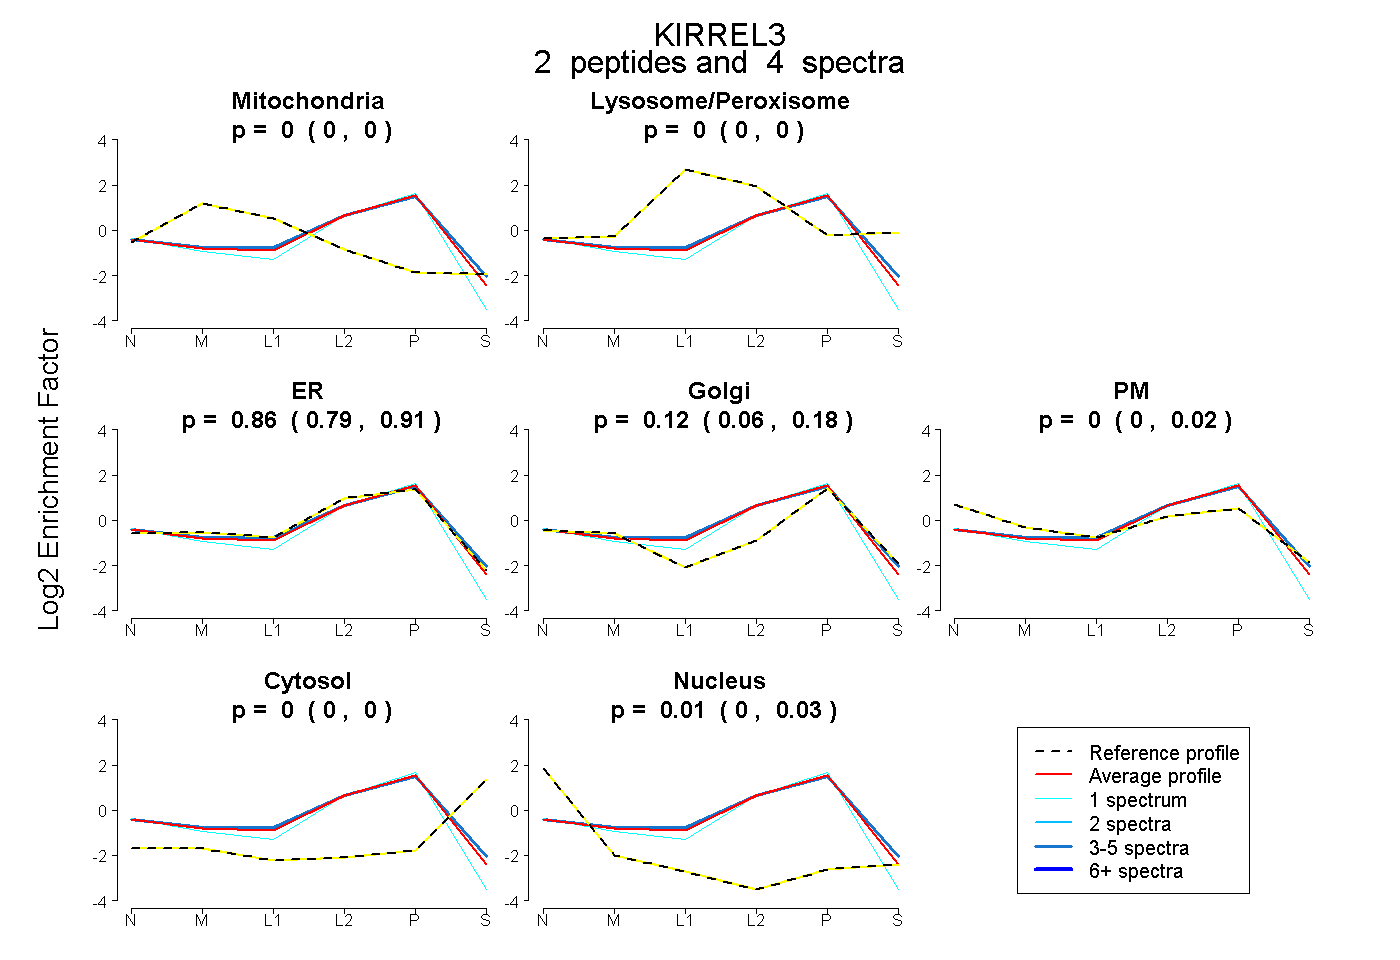
0.000 | 0.000
0.000 | 0.002
0.787 | 0.906
0.059 | 0.181
0.000 | 0.022
0.000 | 0.000
0.000 | 0.025
2peptides
spectra
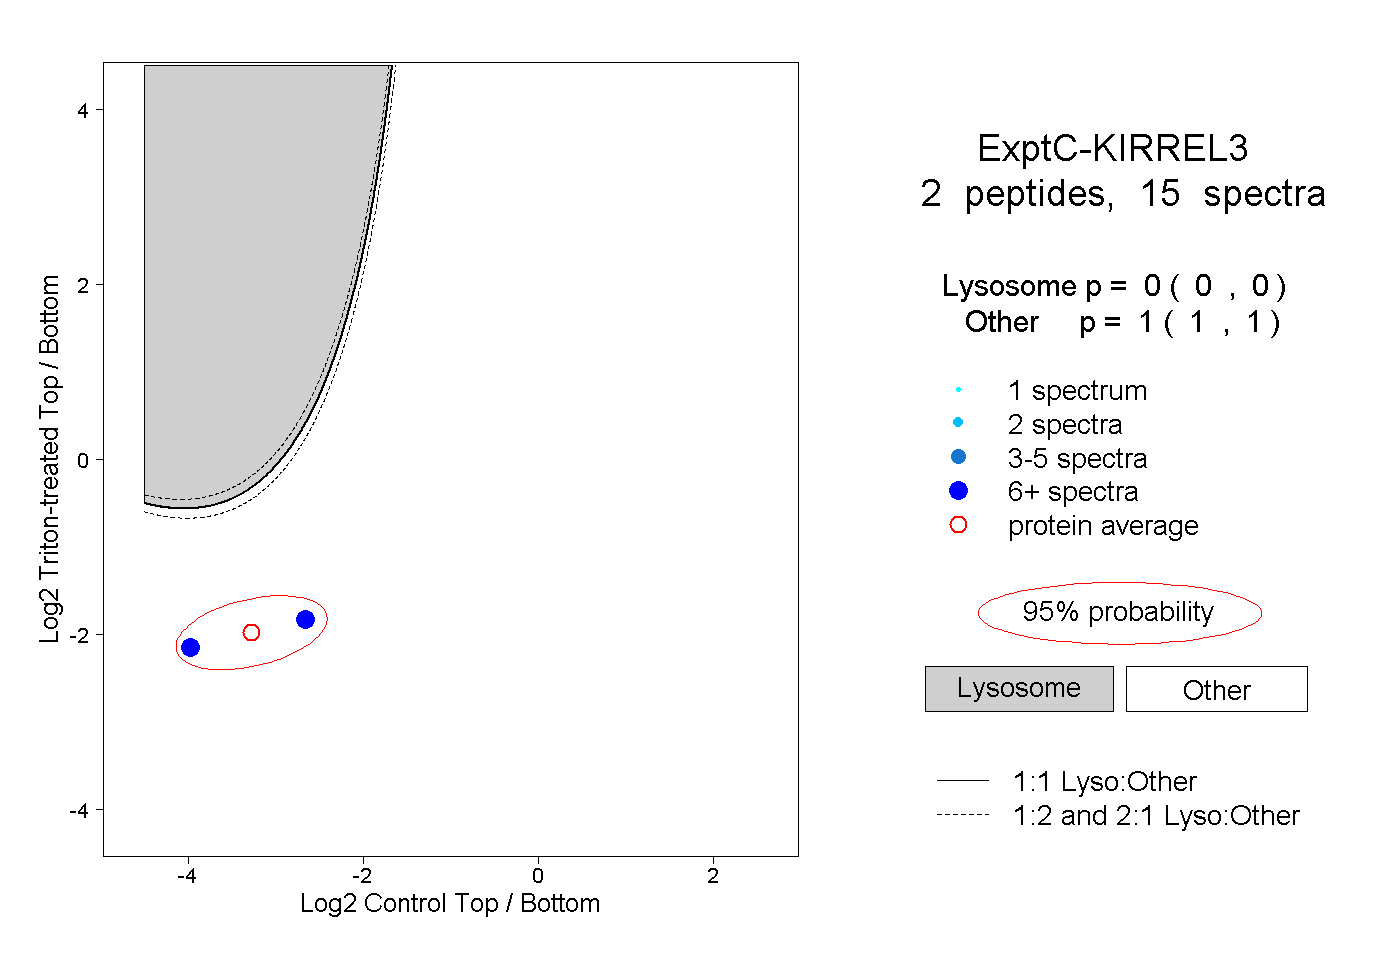
0.000 | 0.000
1.000 | 1.000
1peptide
spectra
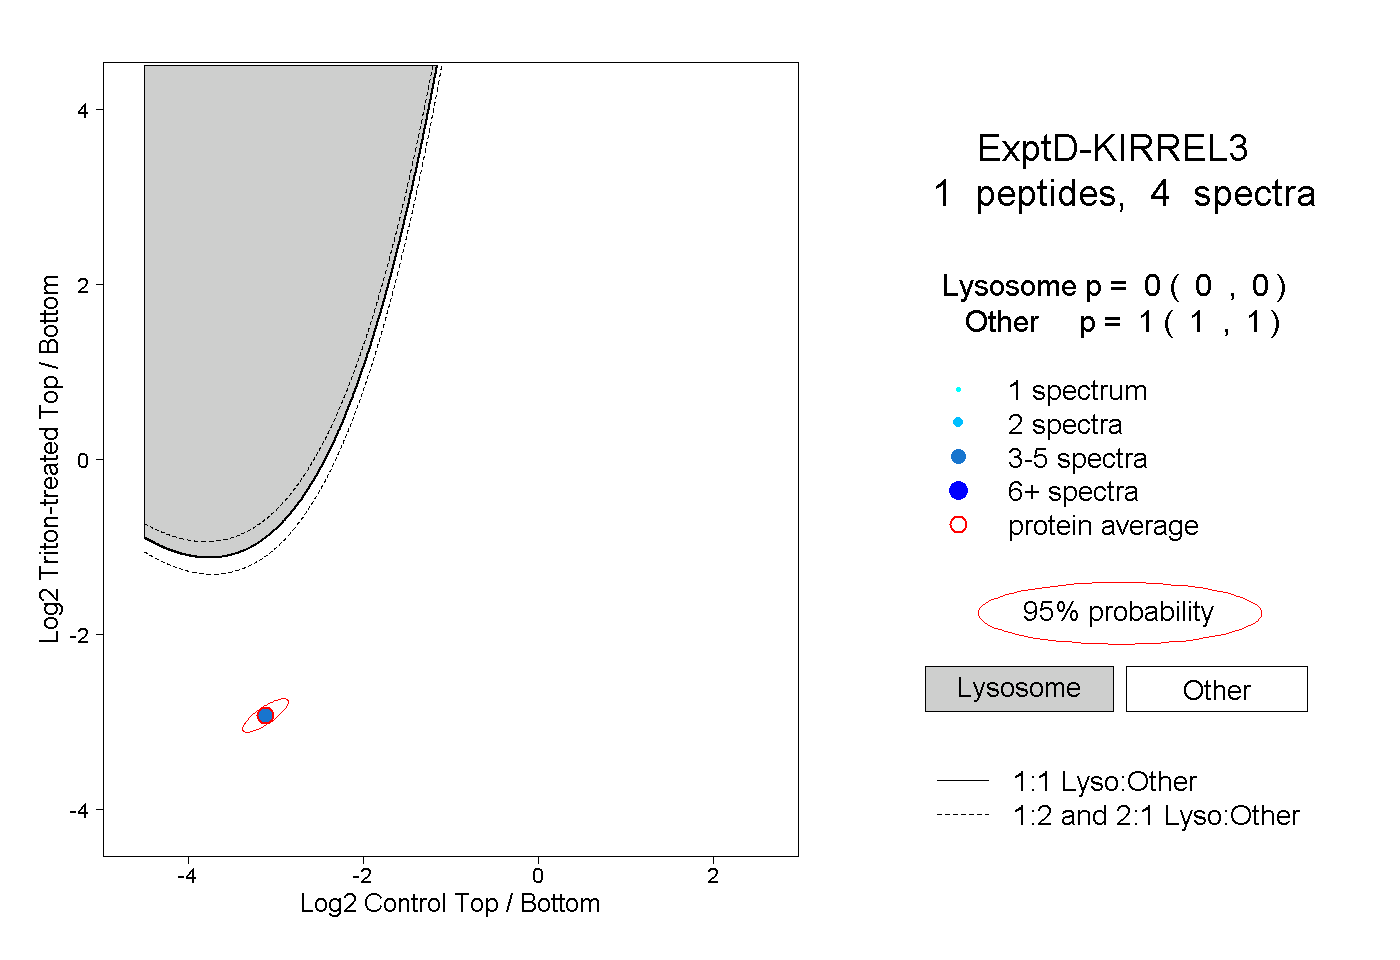
0.000 | 0.000
1.000 | 1.000