 2
2peptides
spectra
0.000 | 0.000
0.000 | 0.025
0.000 | 0.000
0.703 | 0.759
0.154 | 0.202
0.028 | 0.062
0.008 | 0.039
0.000 | 0.000
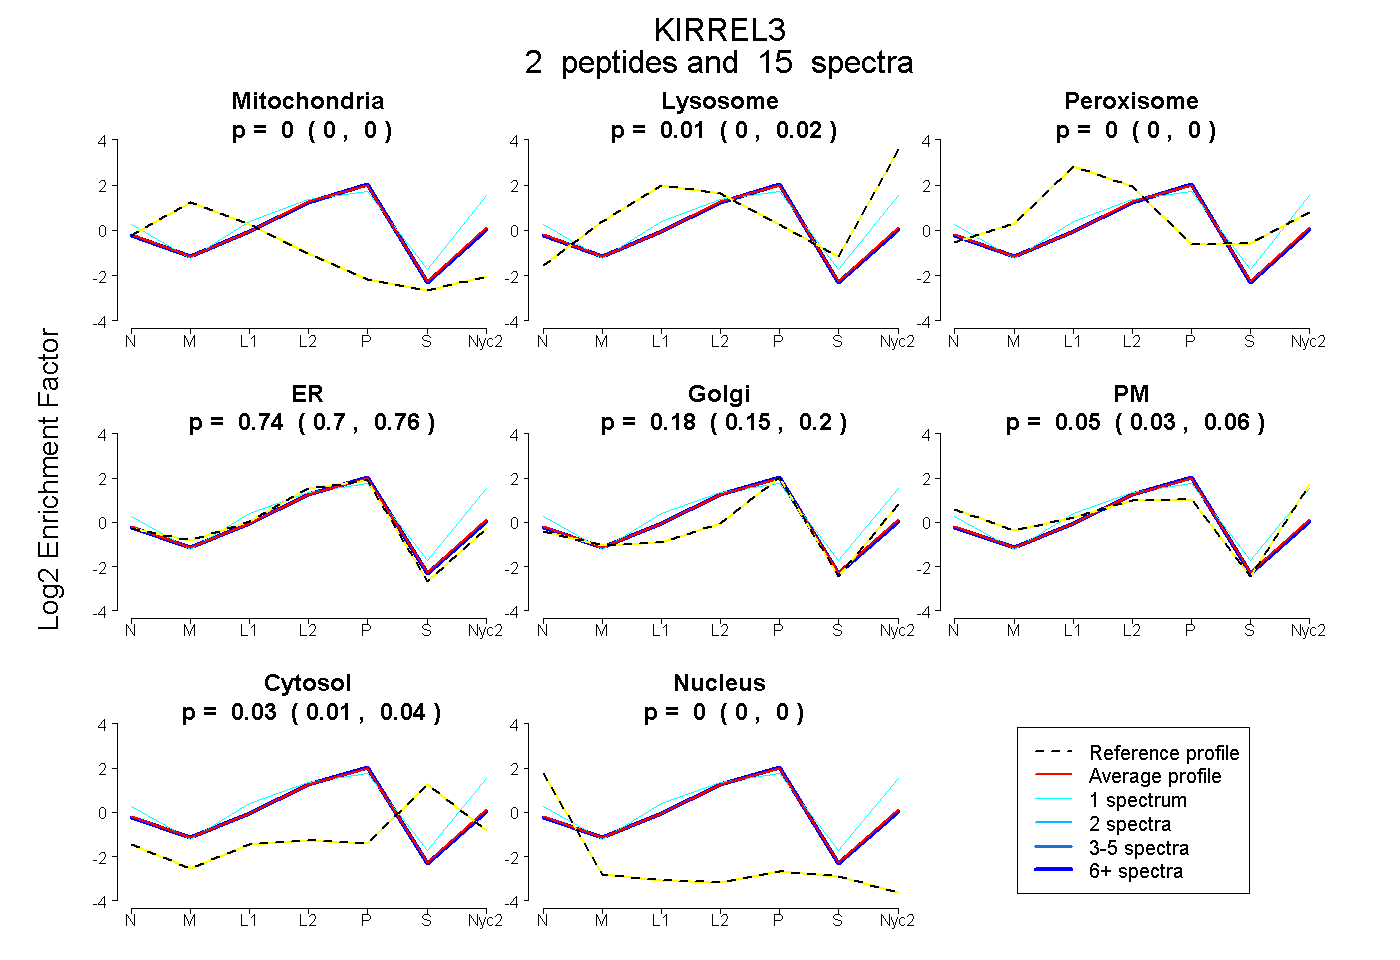
| Plot | Mito | Lyso | Perox | ER | Golgi | PM | Cytosol | Nucleus | |||||
| Expt A |
2 peptides |
15 spectra |
|
0.000 0.000 | 0.000 |
0.012 0.000 | 0.025 |
0.000 0.000 | 0.000 |
0.735 0.703 | 0.759 |
0.180 0.154 | 0.202 |
0.046 0.028 | 0.062 |
0.026 0.008 | 0.039 |
0.000 0.000 | 0.000 |
| 1 spectrum, EASGELYR | 0.000 | 0.125 | 0.000 | 0.265 | 0.085 | 0.498 | 0.027 | 0.000 | ||
| 14 spectra, AIPGGK | 0.000 | 0.004 | 0.000 | 0.769 | 0.187 | 0.014 | 0.026 | 0.000 |
| Plot | Mito | Lyso or Perox | ER | Golgi | PM | Cytosol | Nucleus | ||||||
| Expt B |
2 peptides |
4 spectra |
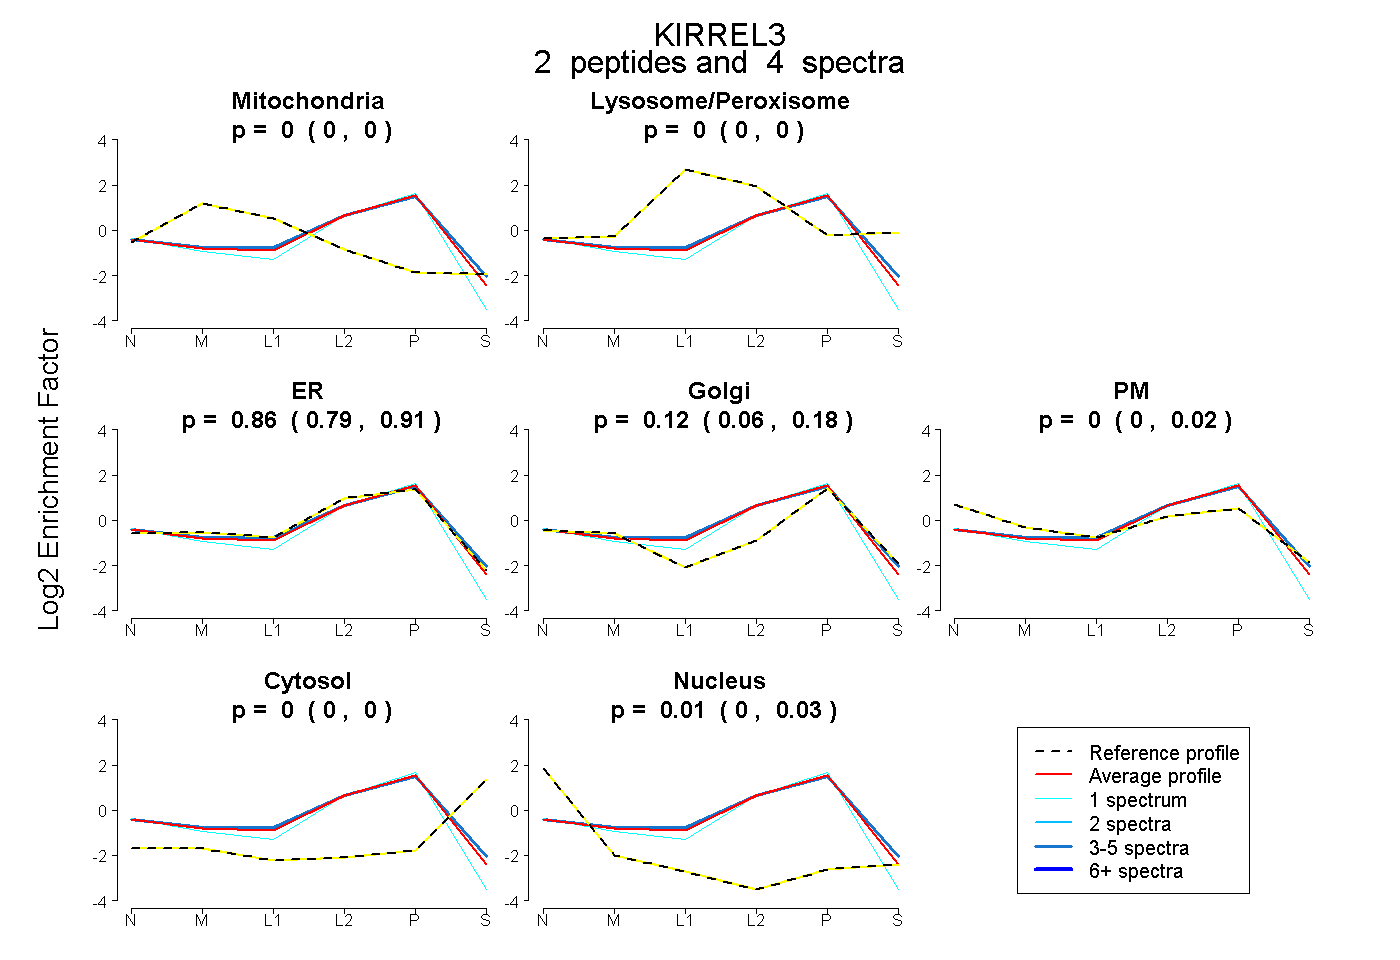 |
0.000 0.000 | 0.000 |
0.000 0.000 | 0.002 |
0.864 0.787 | 0.906 |
0.123 0.059 | 0.181 |
0.000 0.000 | 0.022 |
0.000 0.000 | 0.000 |
0.013 0.000 | 0.025 |
|||
| Plot | Lyso | Other | |||||||||||
| Expt C |
2 peptides |
15 spectra |
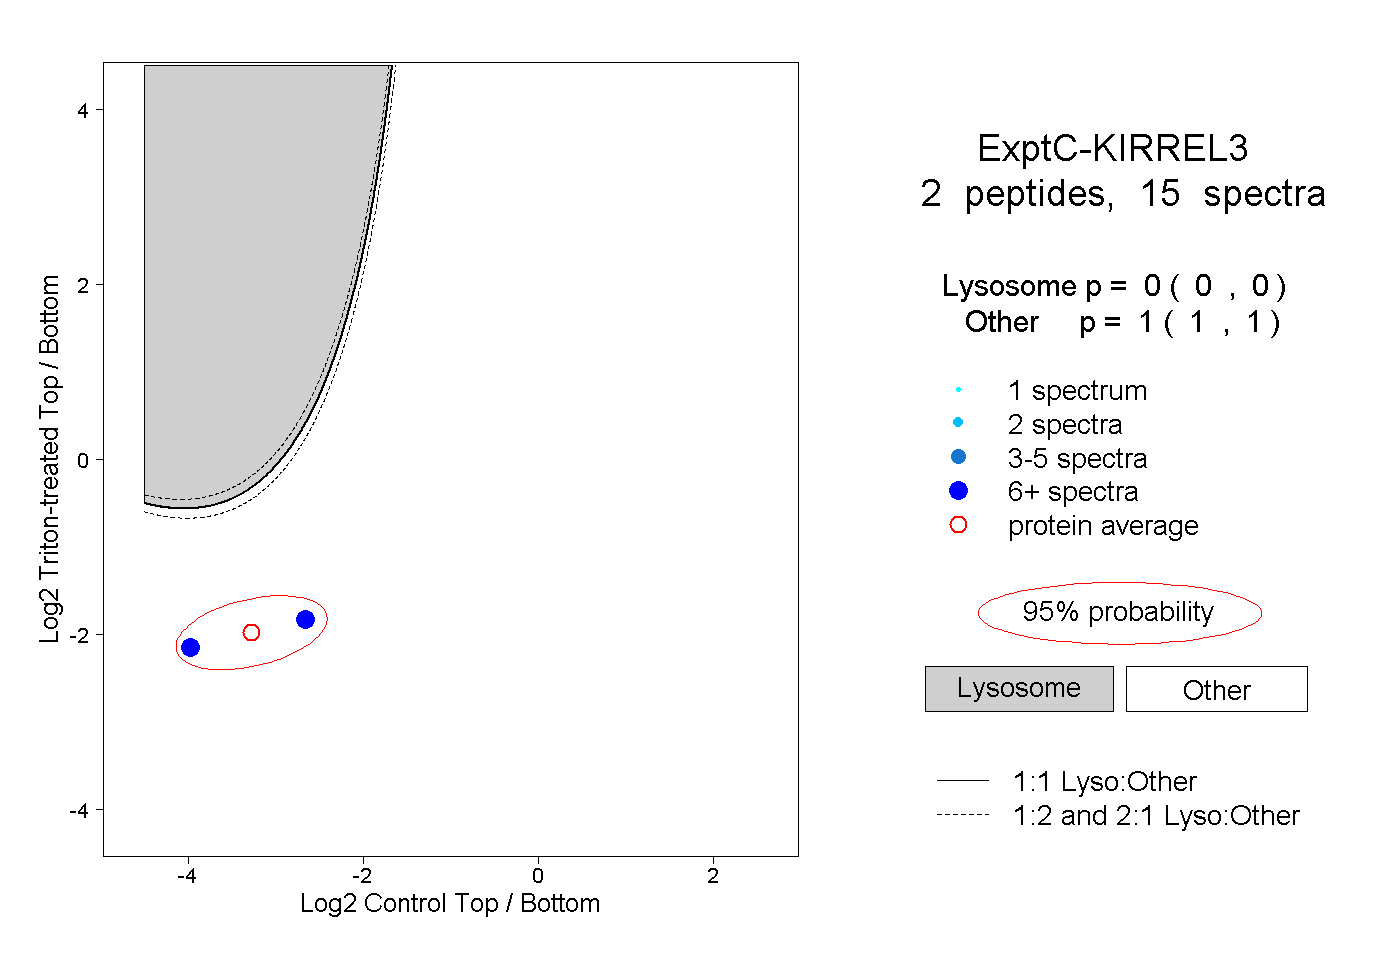 |
0.000 0.000 | 0.000 |
1.000 1.000 | 1.000 |
||||||||
| Plot | Lyso | Other | |||||||||||
| Expt D |
1 peptide |
4 spectra |
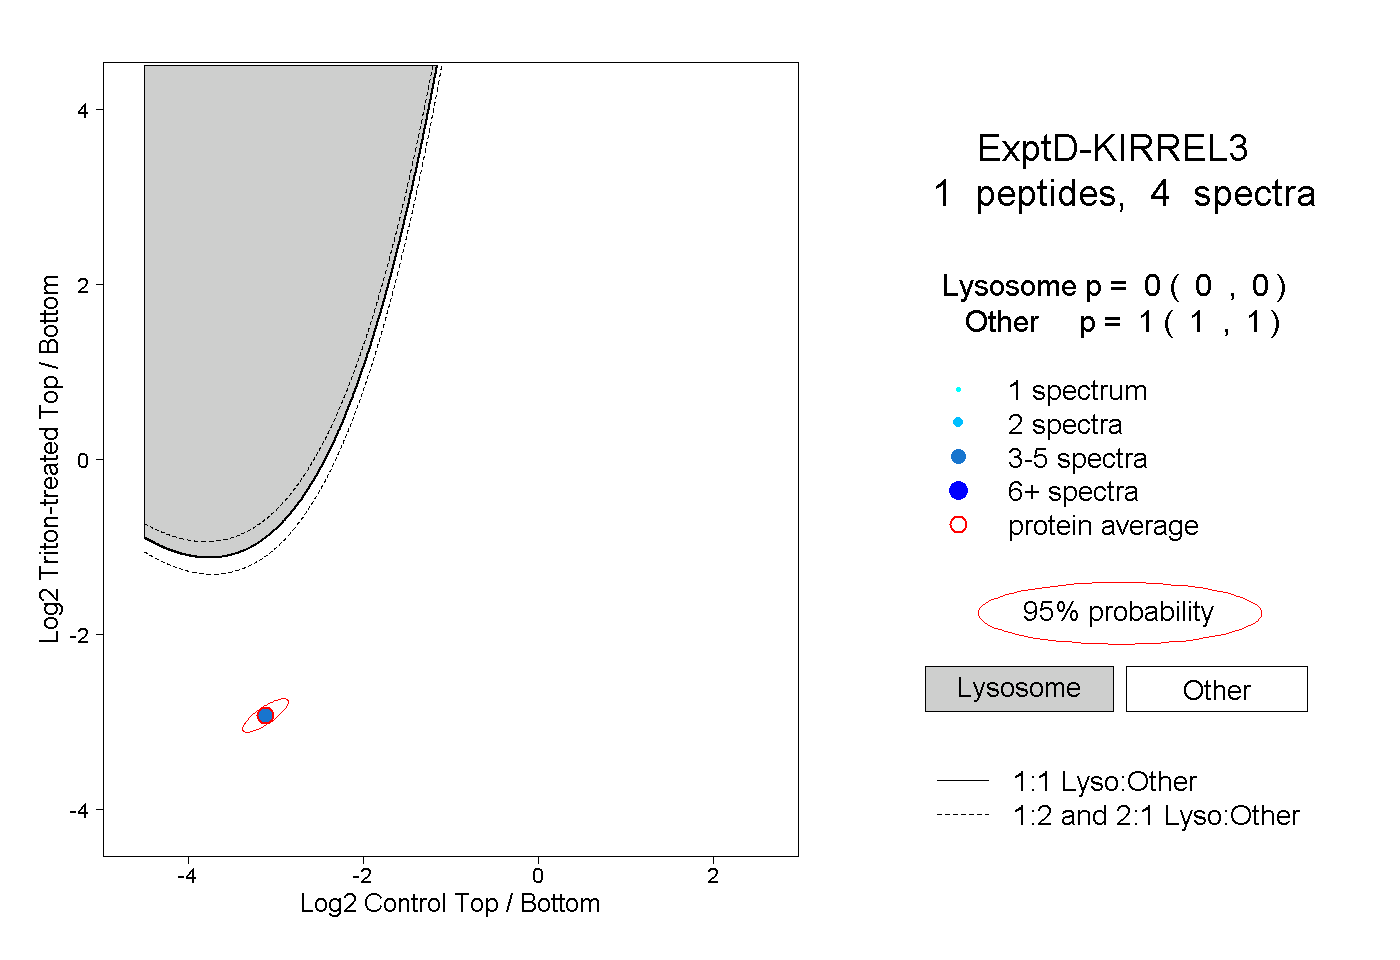 |
0.000 0.000 | 0.000 |
1.000 1.000 | 1.000 |