 8
8peptides
spectra
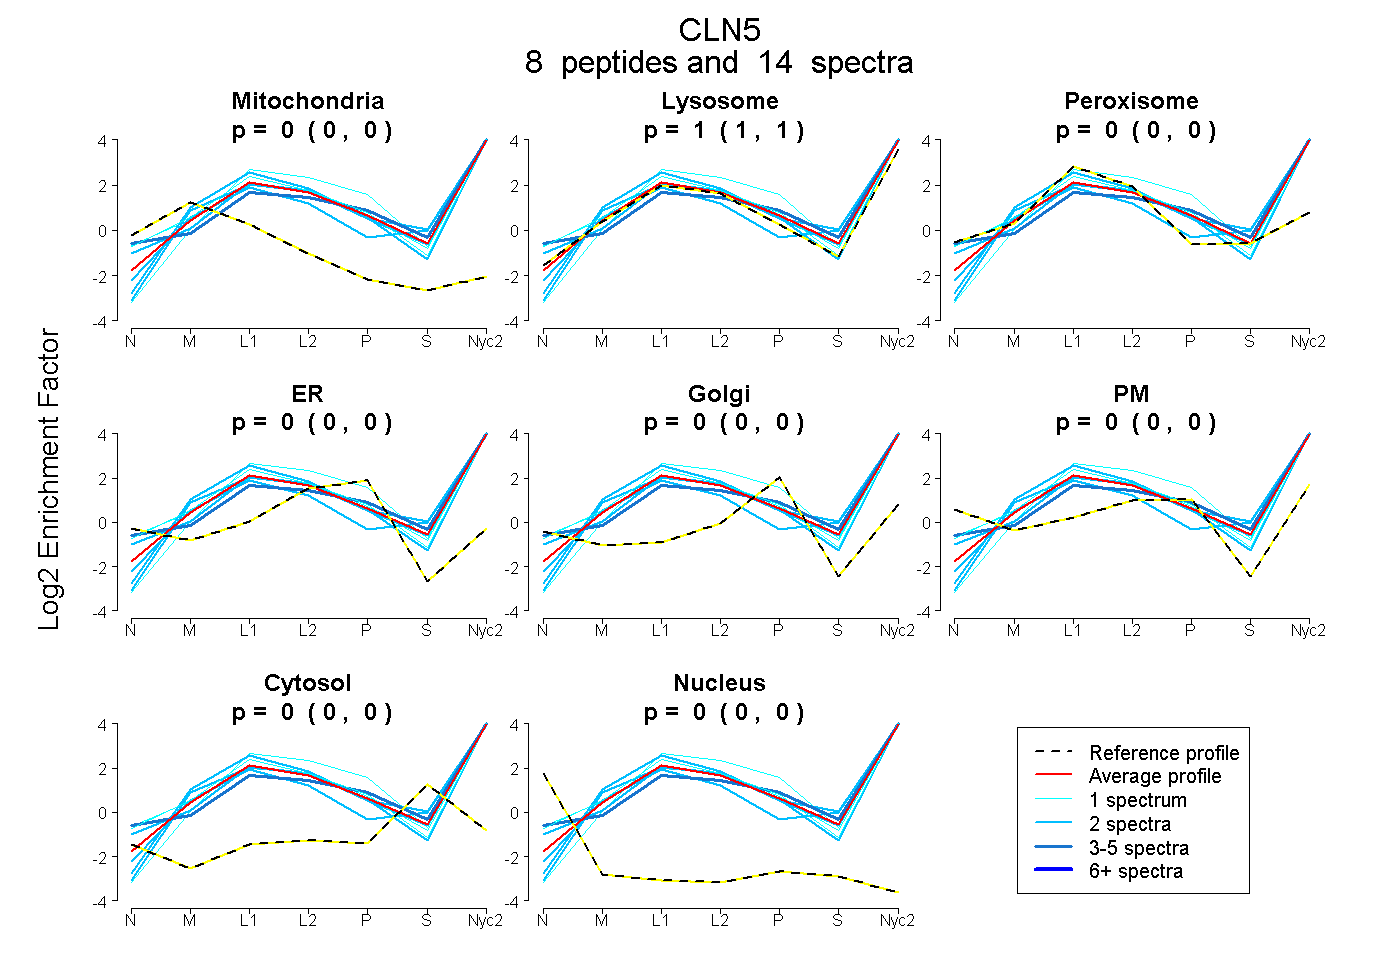
0.000 | 0.000
1.000 | 1.000
0.000 | 0.000
0.000 | 0.000
0.000 | 0.000
0.000 | 0.000
0.000 | 0.000
0.000 | 0.000
2peptides
spectra
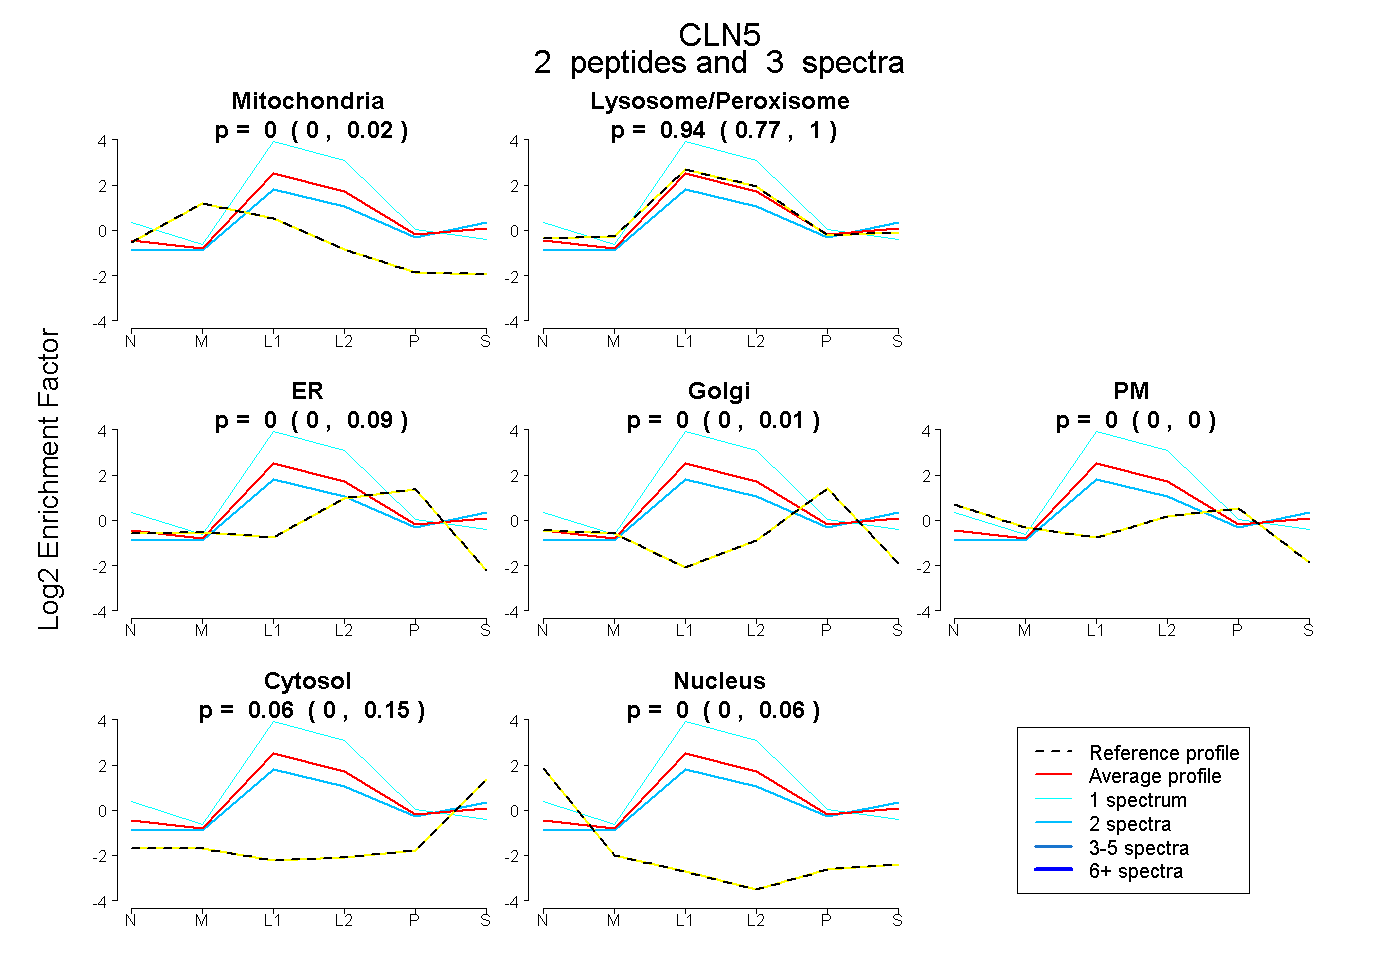
0.000 | 0.025
0.769 | 1.000
0.000 | 0.090
0.000 | 0.005
0.000 | 0.001
0.000 | 0.149
0.000 | 0.059
8peptides
spectra
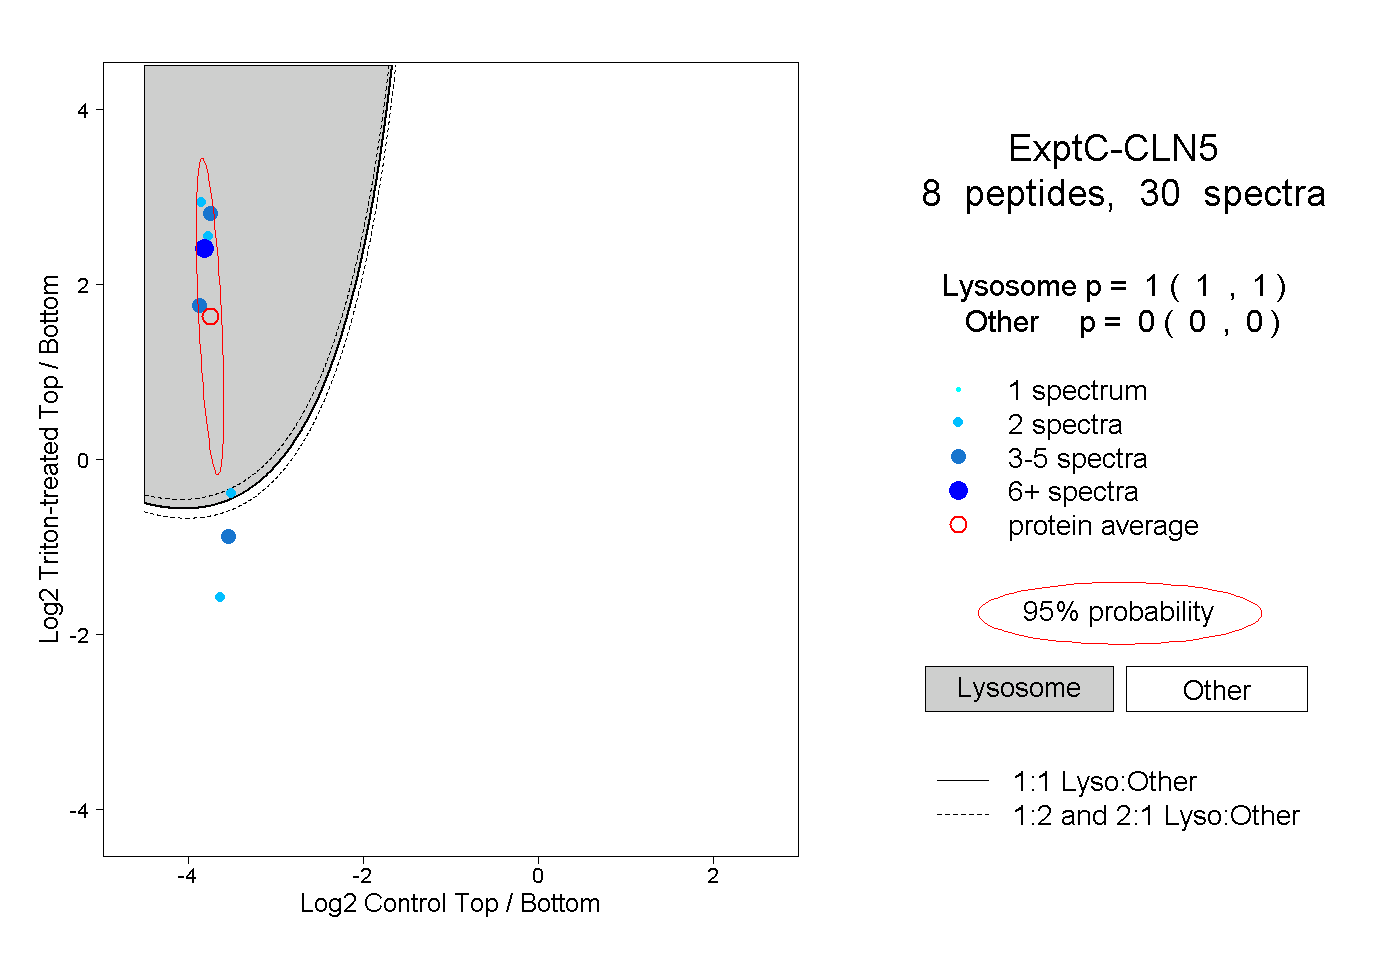
1.000 | 1.000
0.000 | 0.000
1peptide
spectrum
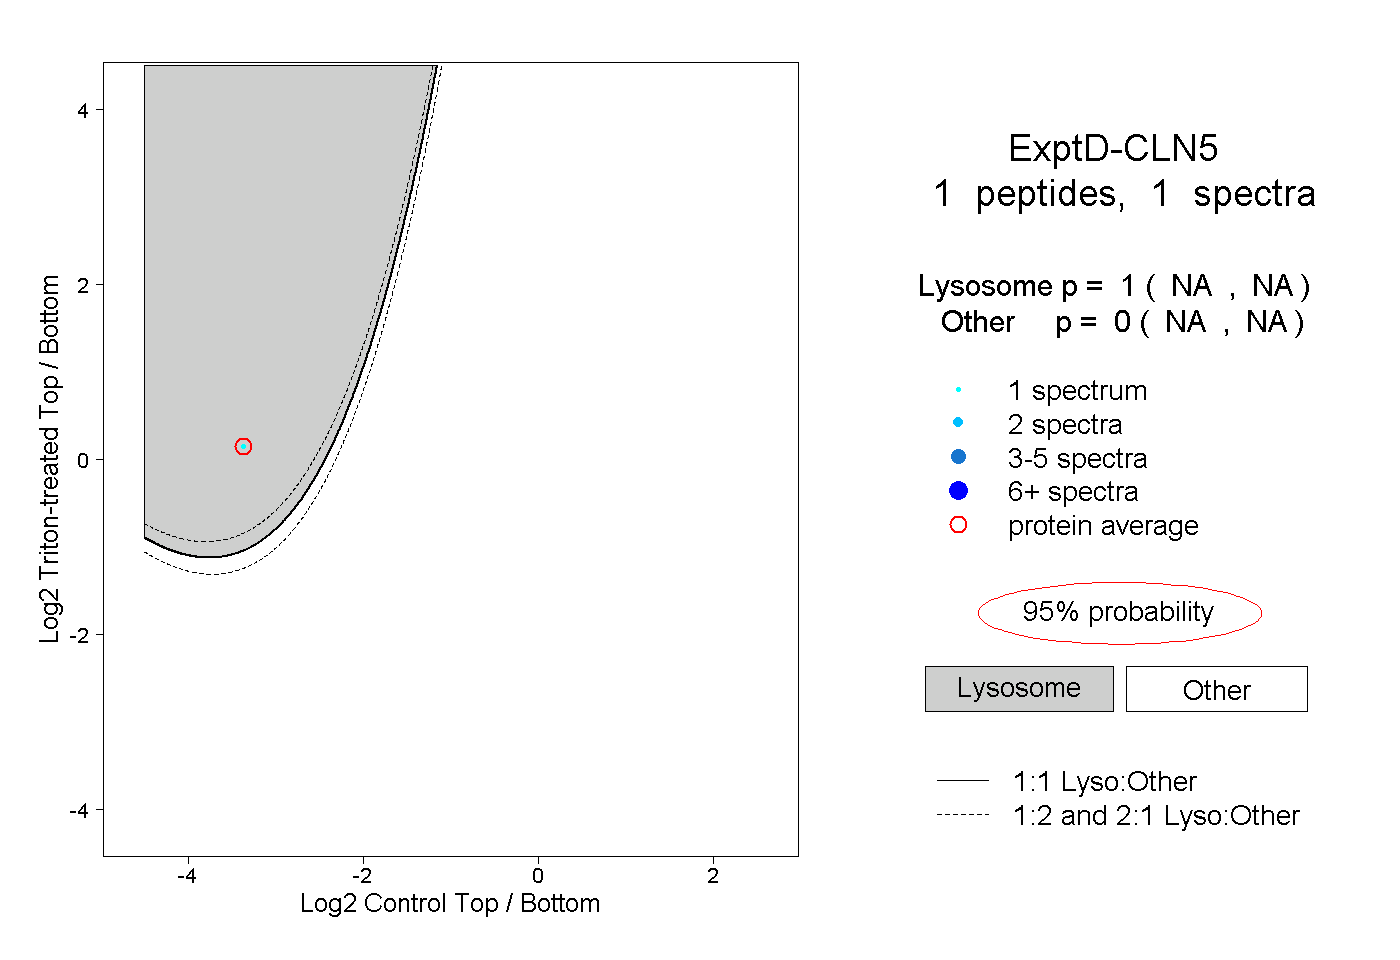
NA | NA
NA | NA