 8
8peptides
spectra
0.000 | 0.000
1.000 | 1.000
0.000 | 0.000
0.000 | 0.000
0.000 | 0.000
0.000 | 0.000
0.000 | 0.000
0.000 | 0.000
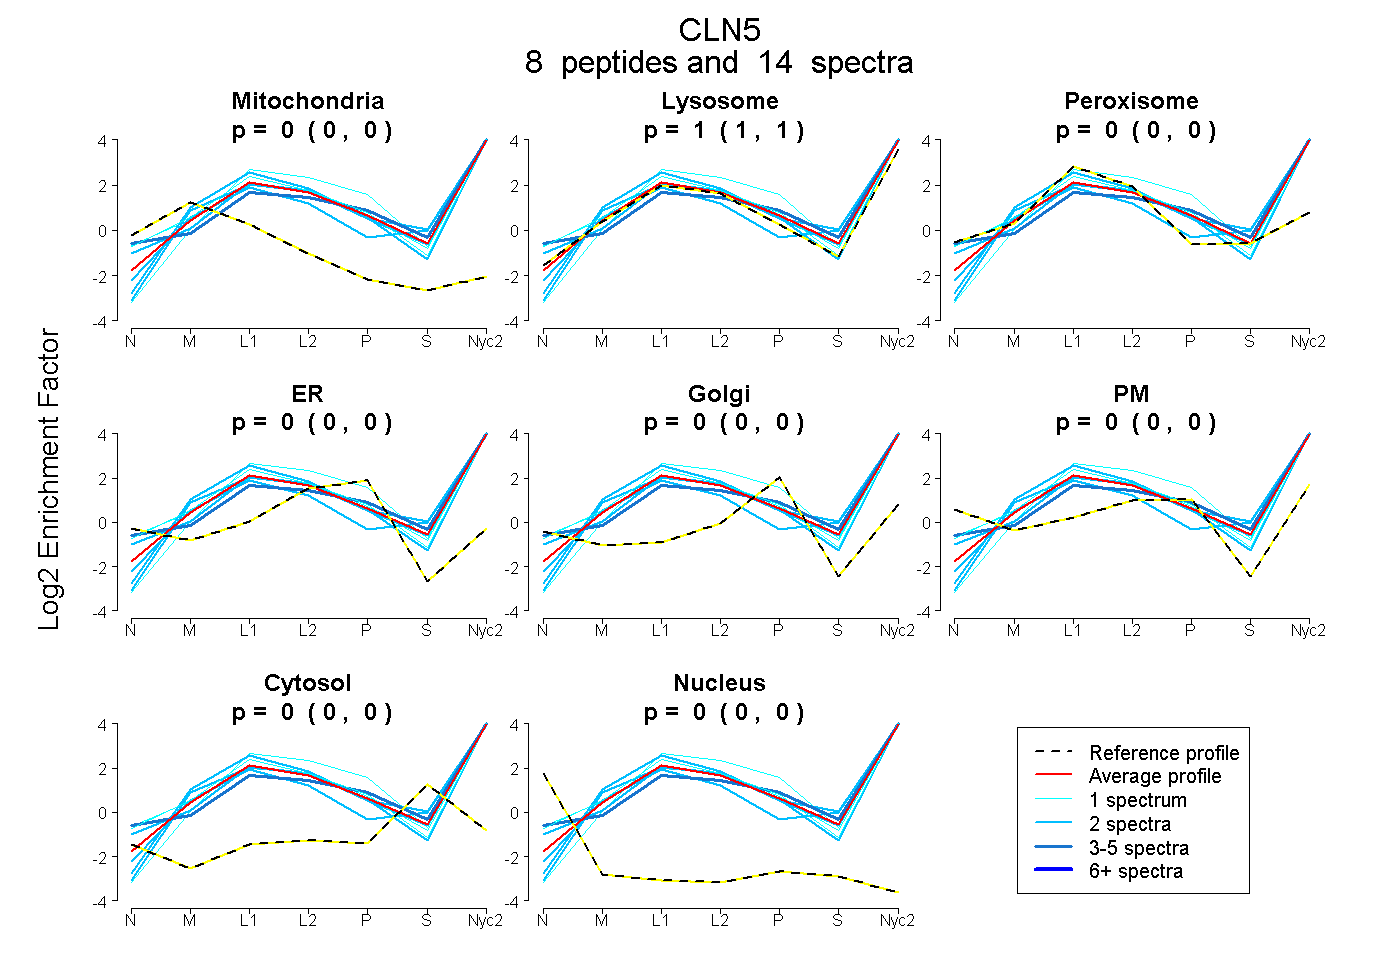
| Plot | Mito | Lyso | Perox | ER | Golgi | PM | Cytosol | Nucleus | |||||
| Expt A |
8 peptides |
14 spectra |
|
0.000 0.000 | 0.000 |
1.000 1.000 | 1.000 |
0.000 0.000 | 0.000 |
0.000 0.000 | 0.000 |
0.000 0.000 | 0.000 |
0.000 0.000 | 0.000 |
0.000 0.000 | 0.000 |
0.000 0.000 | 0.000 |
| 2 spectra, TLALAIK | 0.000 | 0.985 | 0.000 | 0.000 | 0.000 | 0.000 | 0.015 | 0.000 | ||
| 2 spectra, WPVPYK | 0.000 | 1.000 | 0.000 | 0.000 | 0.000 | 0.000 | 0.000 | 0.000 | ||
| 2 spectra, IMHDAIGFR | 0.000 | 0.946 | 0.000 | 0.000 | 0.000 | 0.000 | 0.054 | 0.000 | ||
| 2 spectra, IFDTVIMHR | 0.000 | 1.000 | 0.000 | 0.000 | 0.000 | 0.000 | 0.000 | 0.000 | ||
| 1 spectrum, YGDLLGHFK | 0.000 | 0.973 | 0.000 | 0.000 | 0.000 | 0.027 | 0.000 | 0.000 | ||
| 1 spectrum, FSFRPK | 0.000 | 0.947 | 0.000 | 0.000 | 0.000 | 0.053 | 0.000 | 0.000 | ||
| 1 spectrum, DNDVIEVLR | 0.000 | 1.000 | 0.000 | 0.000 | 0.000 | 0.000 | 0.000 | 0.000 | ||
| 3 spectra, VAEWVK | 0.000 | 0.888 | 0.000 | 0.000 | 0.000 | 0.096 | 0.016 | 0.000 |
| Plot | Mito | Lyso or Perox | ER | Golgi | PM | Cytosol | Nucleus | ||||||
| Expt B |
2 peptides |
3 spectra |
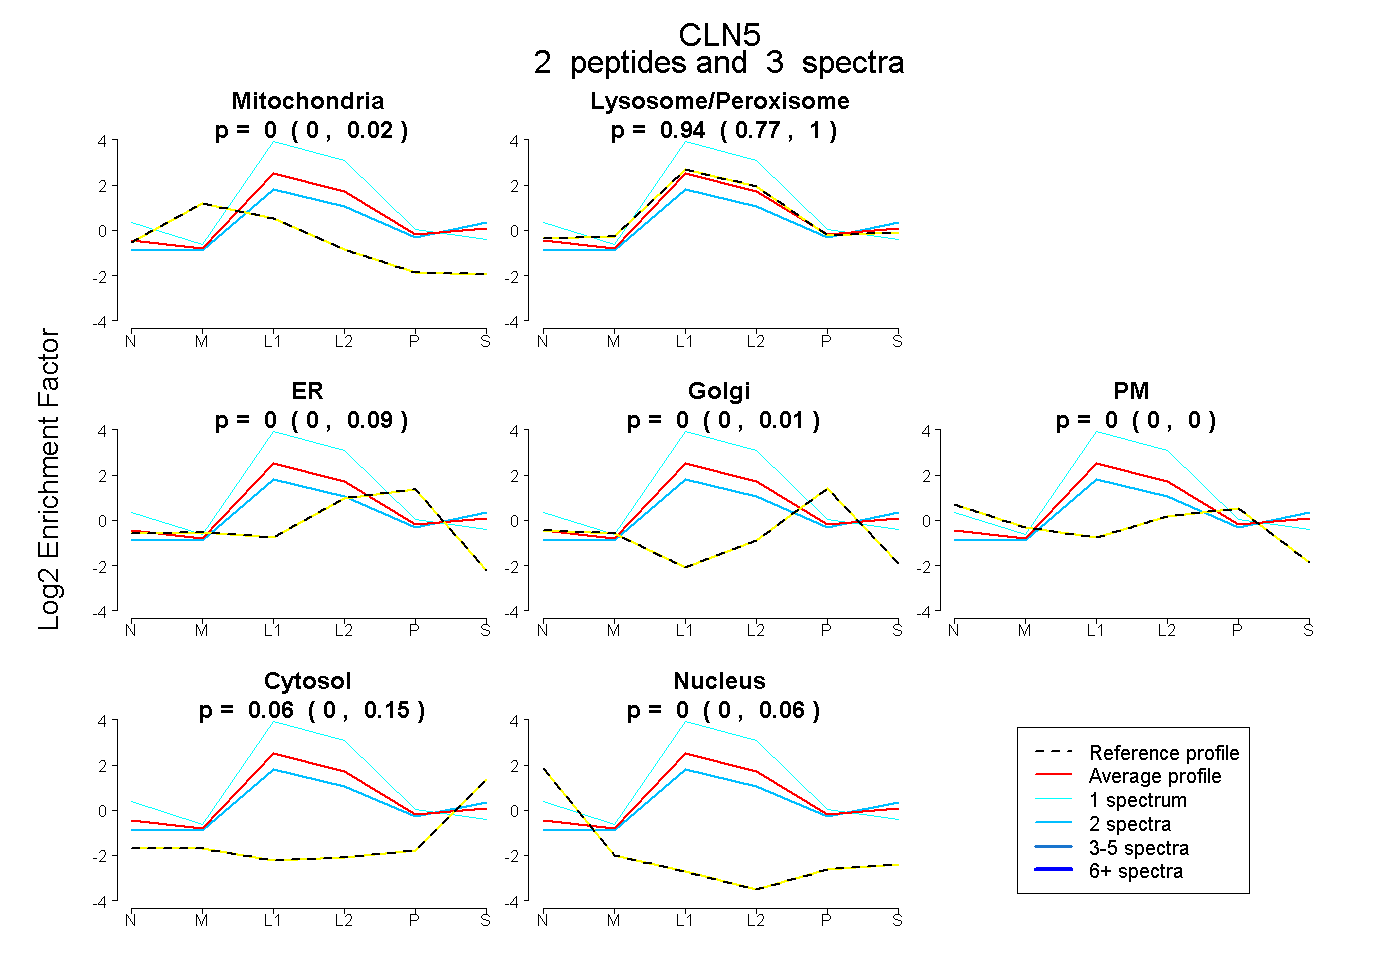 |
0.000 0.000 | 0.025 |
0.940 0.769 | 1.000 |
0.000 0.000 | 0.090 |
0.000 0.000 | 0.005 |
0.000 0.000 | 0.001 |
0.060 0.000 | 0.149 |
0.000 0.000 | 0.059 |
|||
| Plot | Lyso | Other | |||||||||||
| Expt C |
8 peptides |
30 spectra |
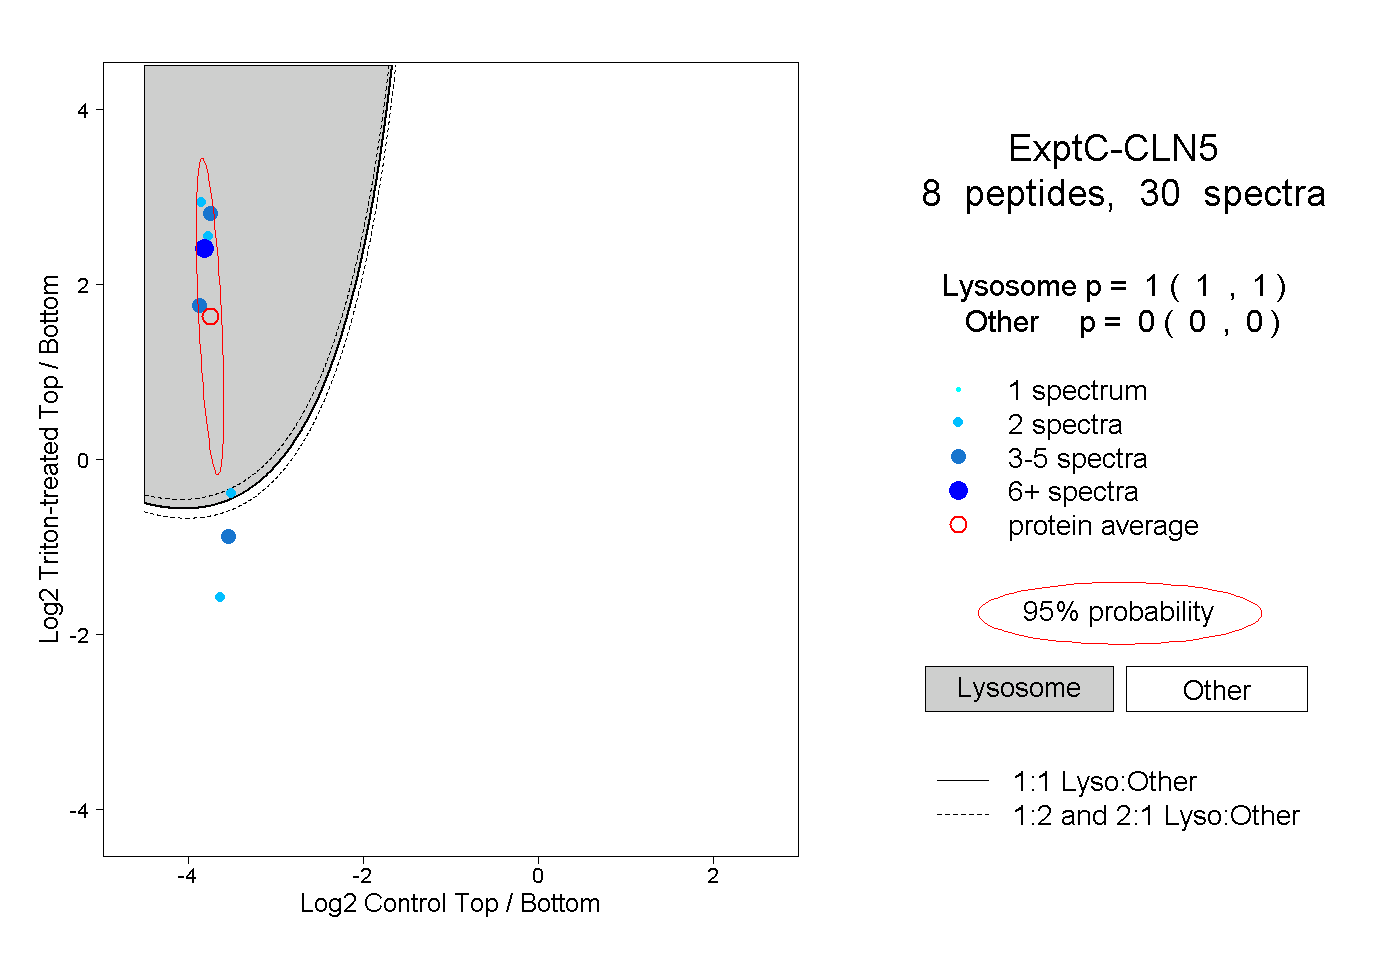 |
1.000 1.000 | 1.000 |
0.000 0.000 | 0.000 |
||||||||
| Plot | Lyso | Other | |||||||||||
| Expt D |
1 peptide |
1 spectrum |
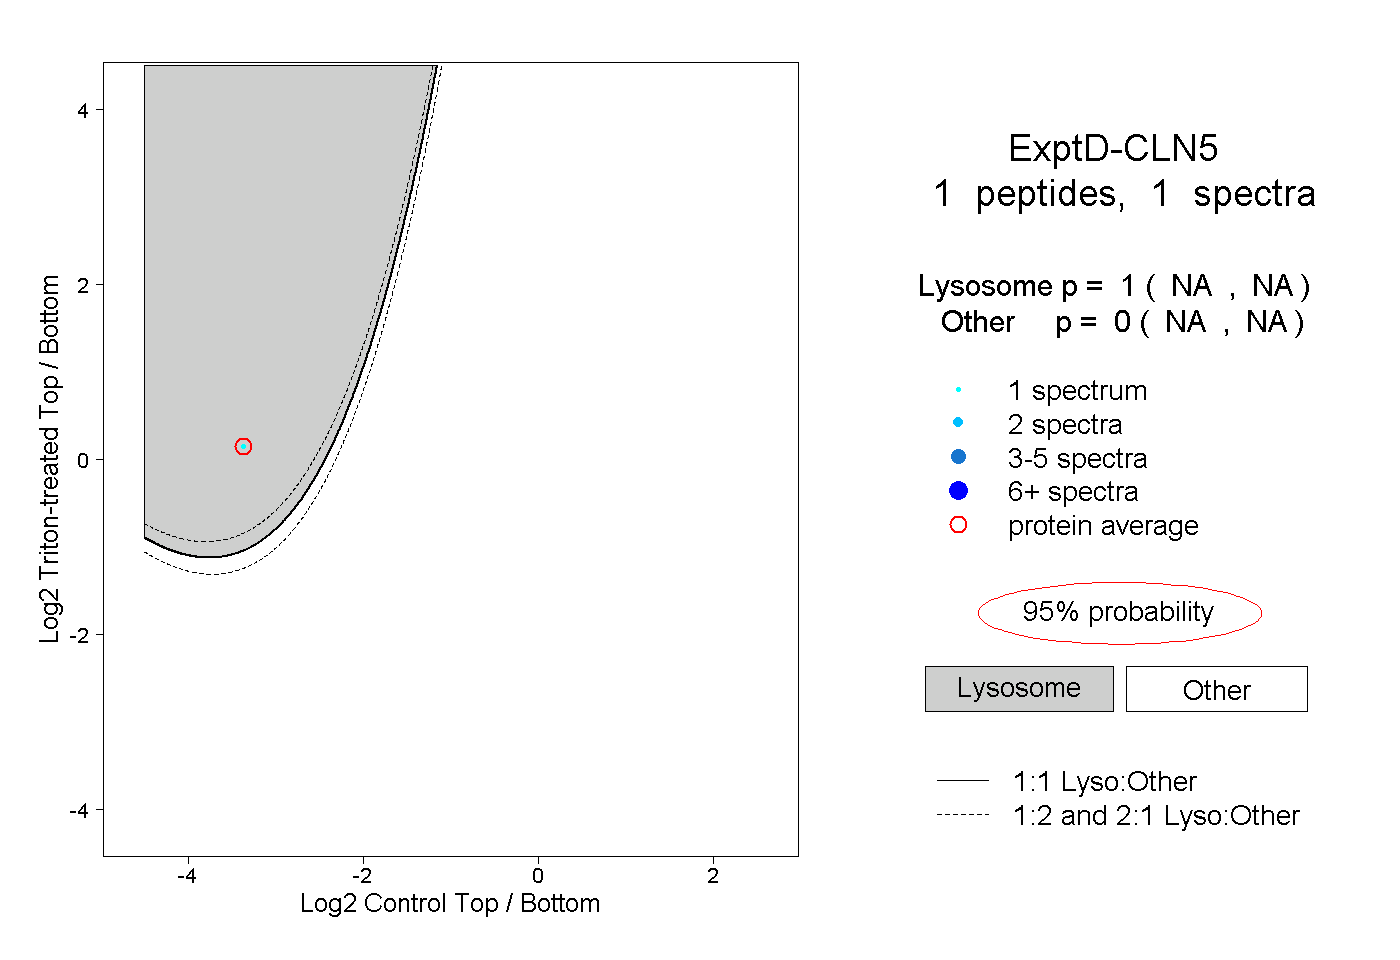 |
1.000 NA | NA |
0.000 NA | NA |