 4
4peptides
spectra
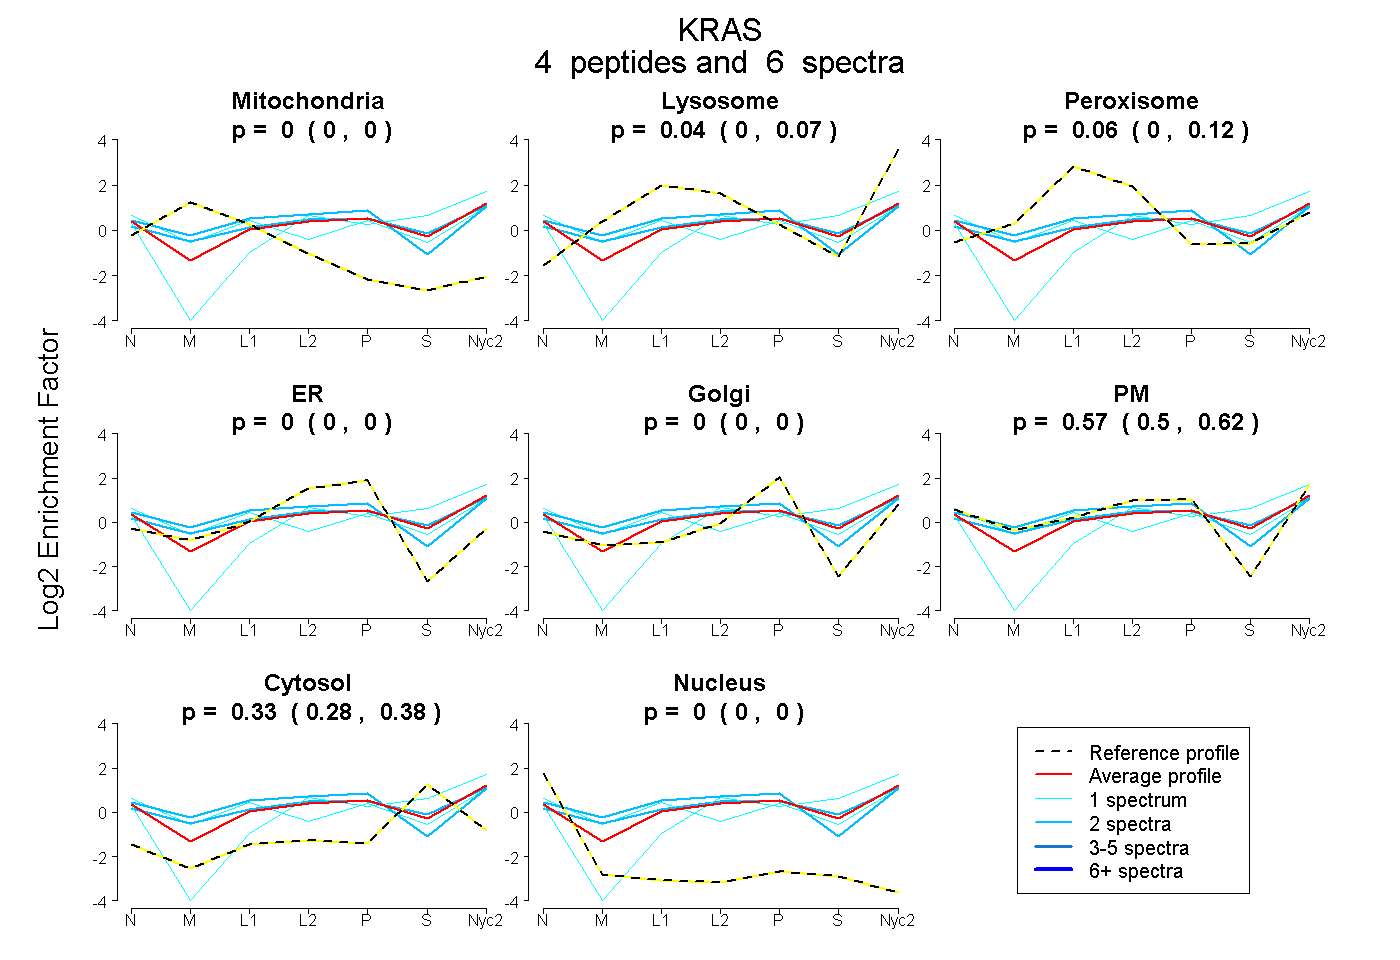
0.000 | 0.000
0.003 | 0.074
0.000 | 0.124
0.000 | 0.000
0.000 | 0.000
0.501 | 0.621
0.281 | 0.379
0.000 | 0.000
2peptides
spectra
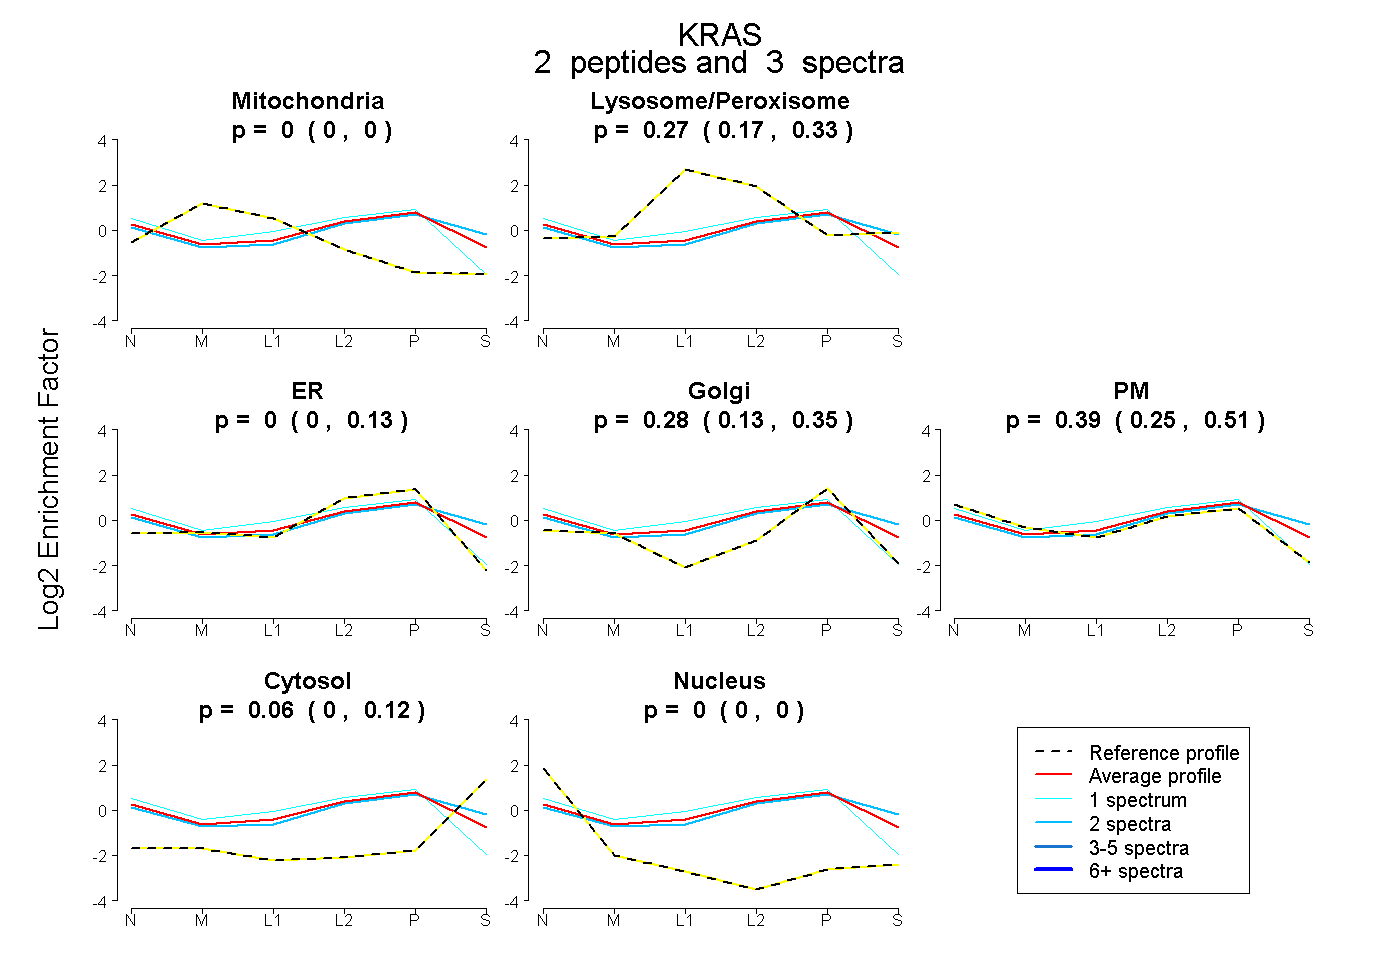
0.000 | 0.000
0.165 | 0.326
0.000 | 0.126
0.130 | 0.350
0.254 | 0.510
0.000 | 0.119
0.000 | 0.000
5peptides
spectra
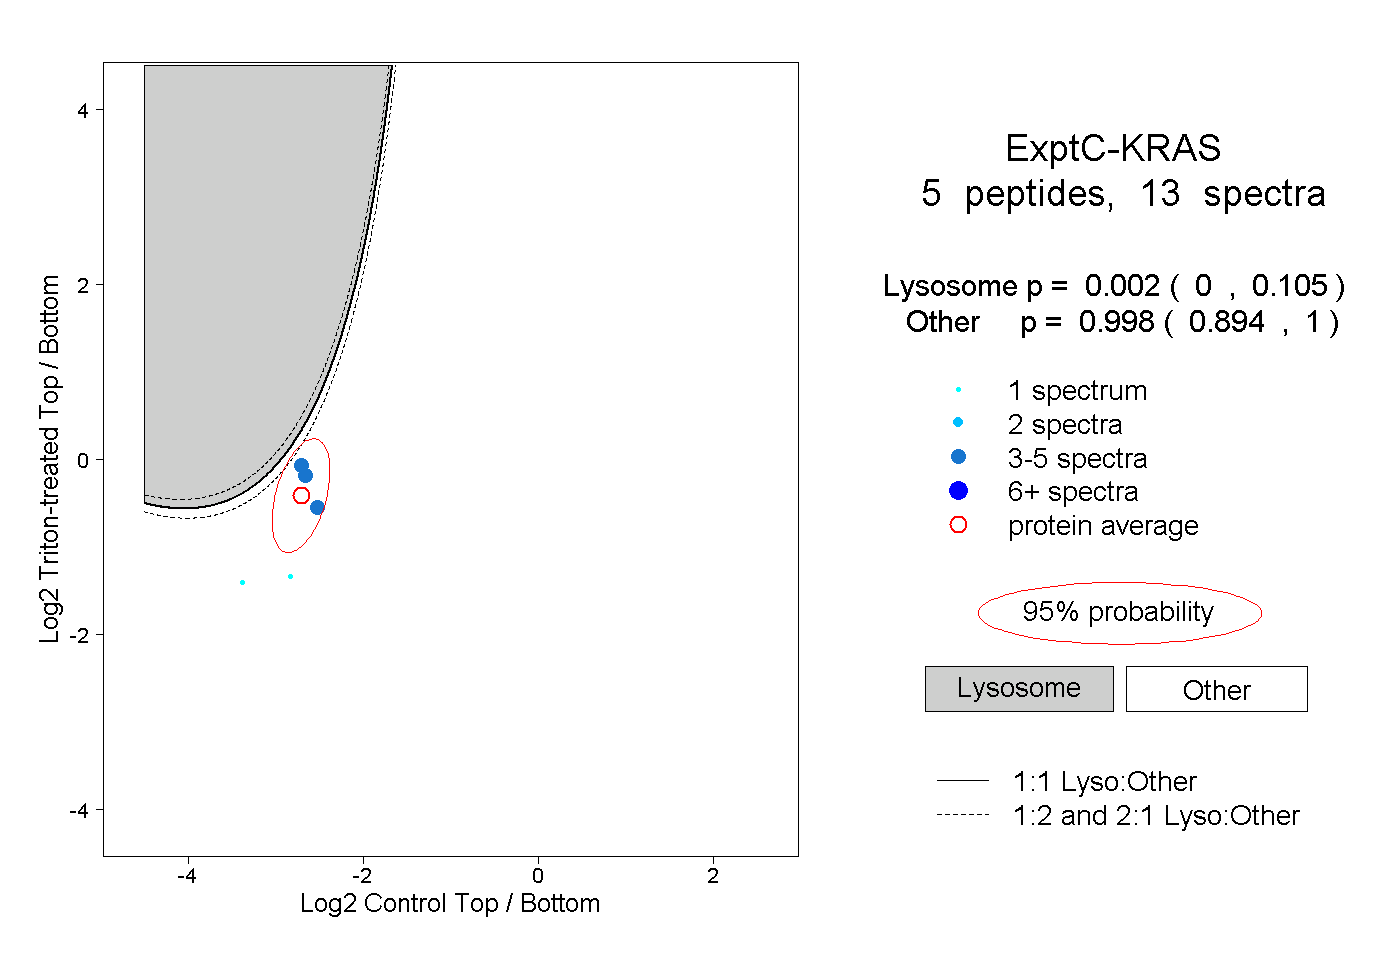
0.000 | 0.105
0.894 | 1.000