 4
4peptides
spectra
0.000 | 0.000
0.003 | 0.074
0.000 | 0.124
0.000 | 0.000
0.000 | 0.000
0.501 | 0.621
0.281 | 0.379
0.000 | 0.000
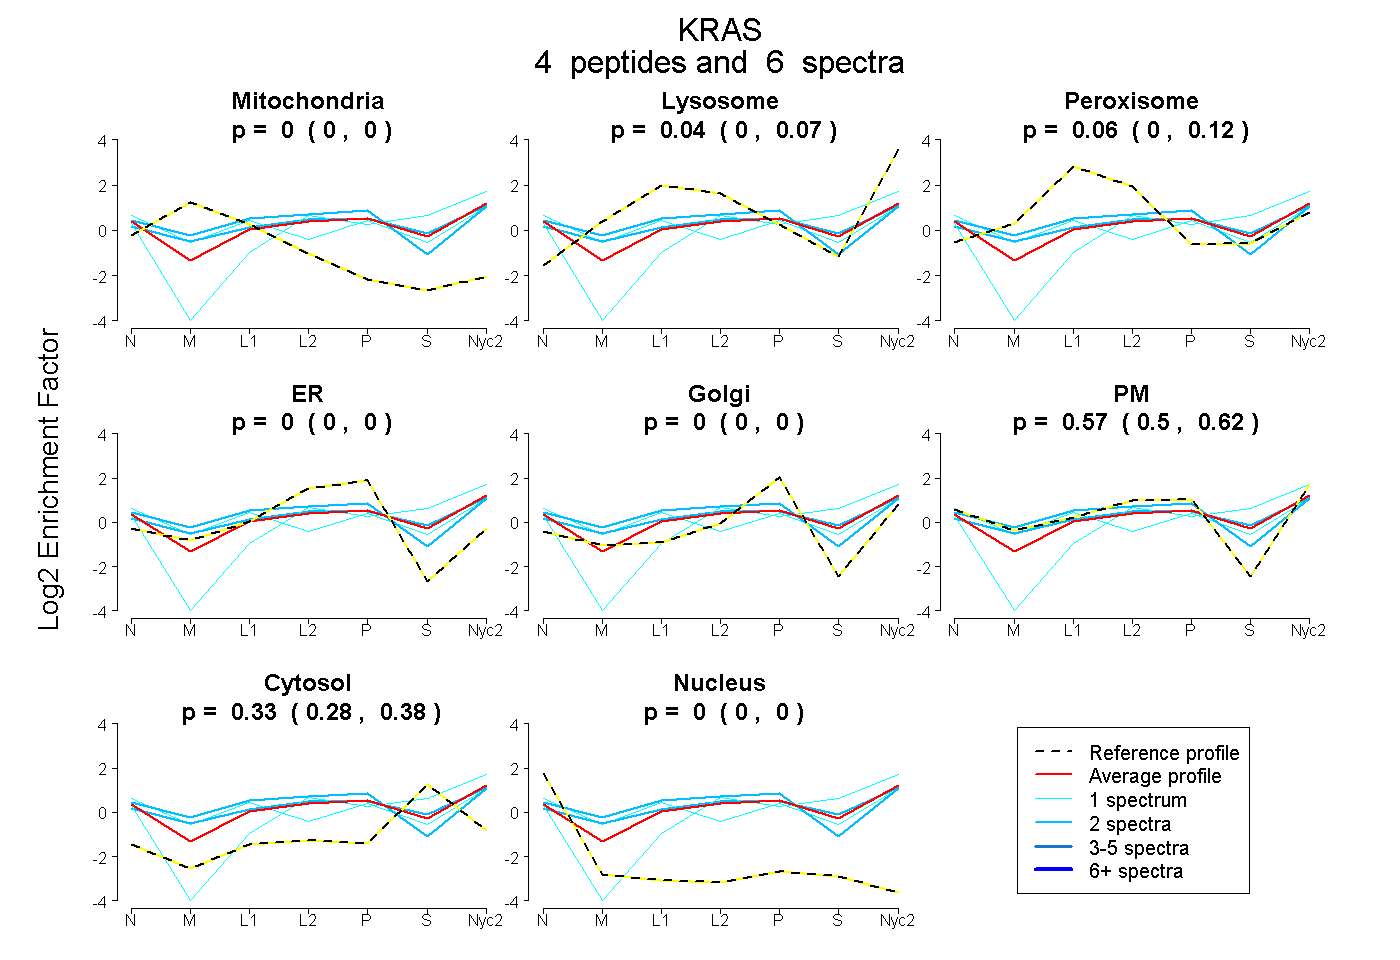
| Plot | Mito | Lyso | Perox | ER | Golgi | PM | Cytosol | Nucleus | |||||
| Expt A |
4 peptides |
6 spectra |
|
0.000 0.000 | 0.000 |
0.043 0.003 | 0.074 |
0.060 0.000 | 0.124 |
0.000 0.000 | 0.000 |
0.000 0.000 | 0.000 |
0.565 0.501 | 0.621 |
0.332 0.281 | 0.379 |
0.000 0.000 | 0.000 |
| 2 spectra, QAQELAR | 0.000 | 0.079 | 0.149 | 0.000 | 0.000 | 0.476 | 0.297 | 0.000 | ||
| 1 spectrum, SYGIPFIETSAK | 0.000 | 0.002 | 0.000 | 0.000 | 0.000 | 0.427 | 0.572 | 0.000 | ||
| 2 spectra, SFEDIHHYR | 0.000 | 0.000 | 0.223 | 0.000 | 0.070 | 0.590 | 0.117 | 0.000 | ||
| 1 spectrum, DSEDVPMVLVGNK | 0.000 | 0.000 | 0.126 | 0.000 | 0.000 | 0.586 | 0.288 | 0.000 |
| Plot | Mito | Lyso or Perox | ER | Golgi | PM | Cytosol | Nucleus | ||||||
| Expt B |
2 peptides |
3 spectra |
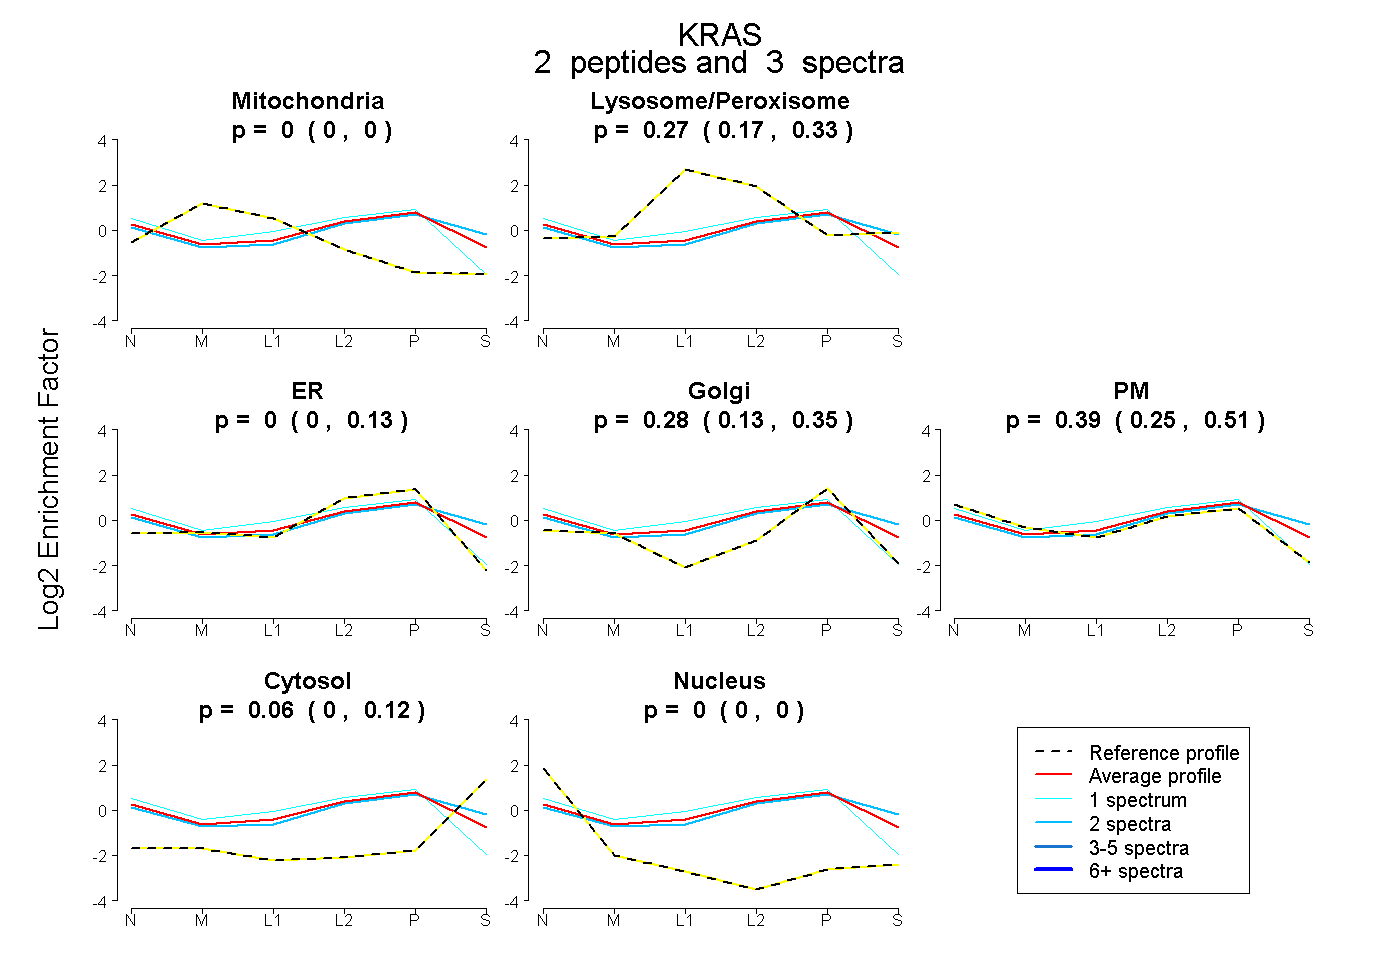 |
0.000 0.000 | 0.000 |
0.274 0.165 | 0.326 |
0.000 0.000 | 0.126 |
0.283 0.130 | 0.350 |
0.386 0.254 | 0.510 |
0.057 0.000 | 0.119 |
0.000 0.000 | 0.000 |
|||
| Plot | Lyso | Other | |||||||||||
| Expt C |
5 peptides |
13 spectra |
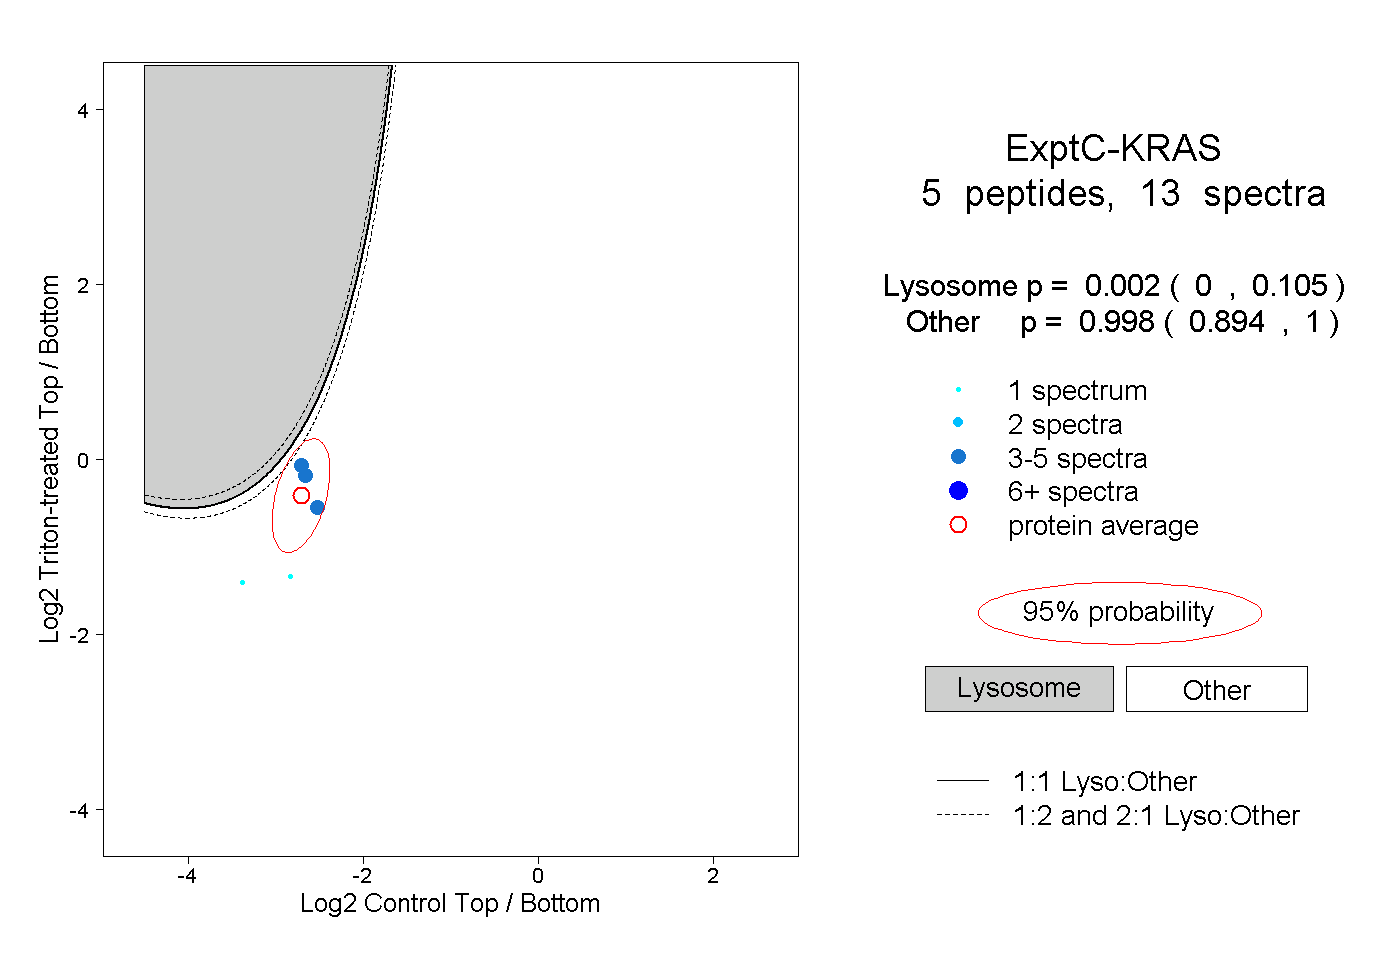 |
0.002 0.000 | 0.105 |
0.998 0.894 | 1.000 |