 26
26peptides
spectra
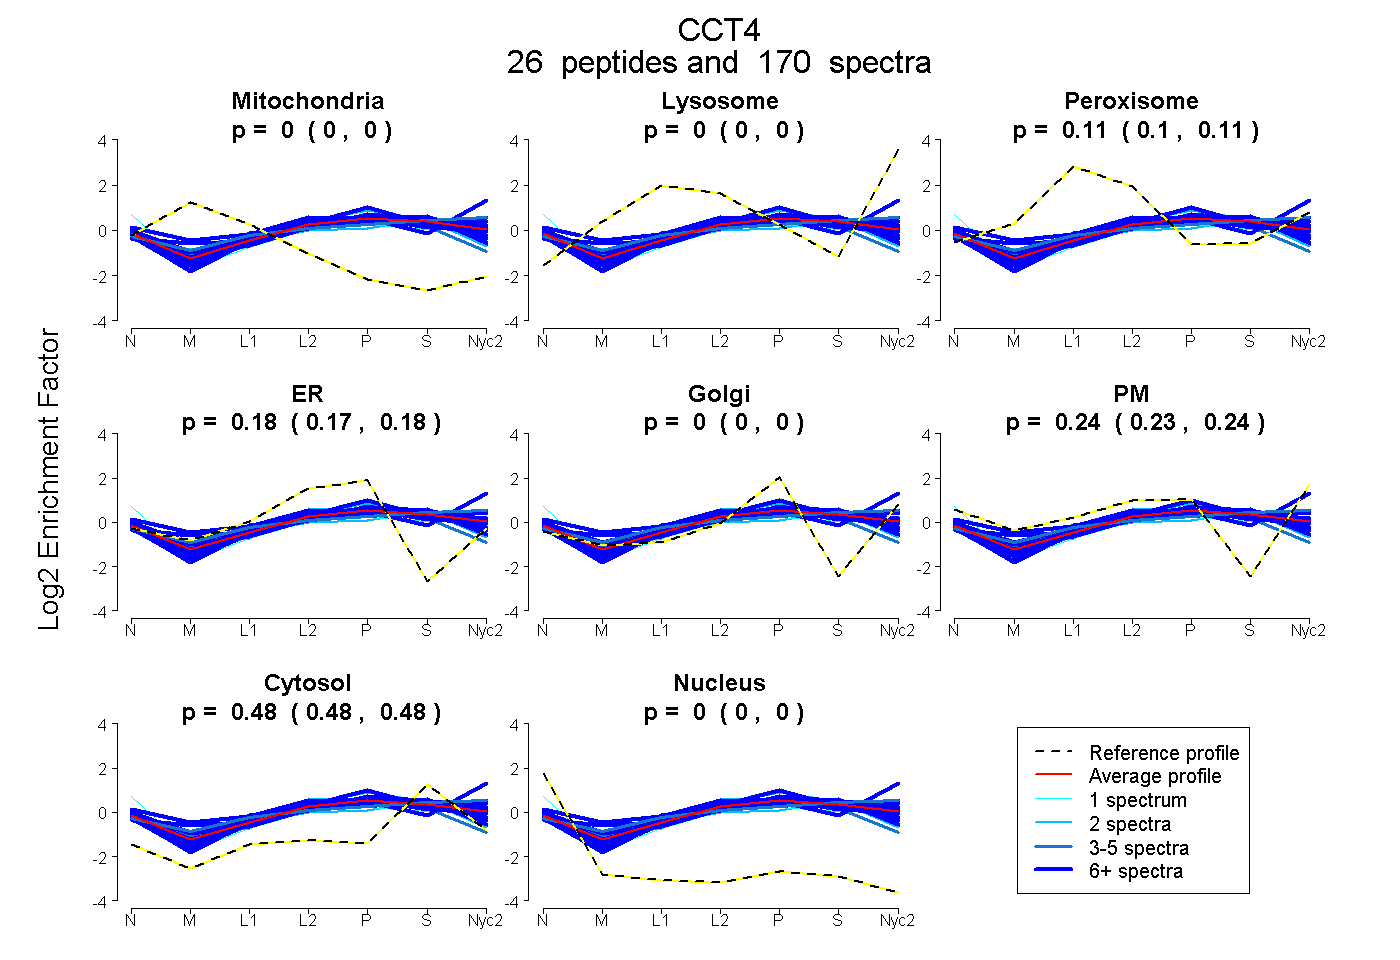
0.000 | 0.000
0.000 | 0.000
0.104 | 0.107
0.171 | 0.179
0.000 | 0.000
0.232 | 0.242
0.480 | 0.482
0.000 | 0.000
17peptides
spectra
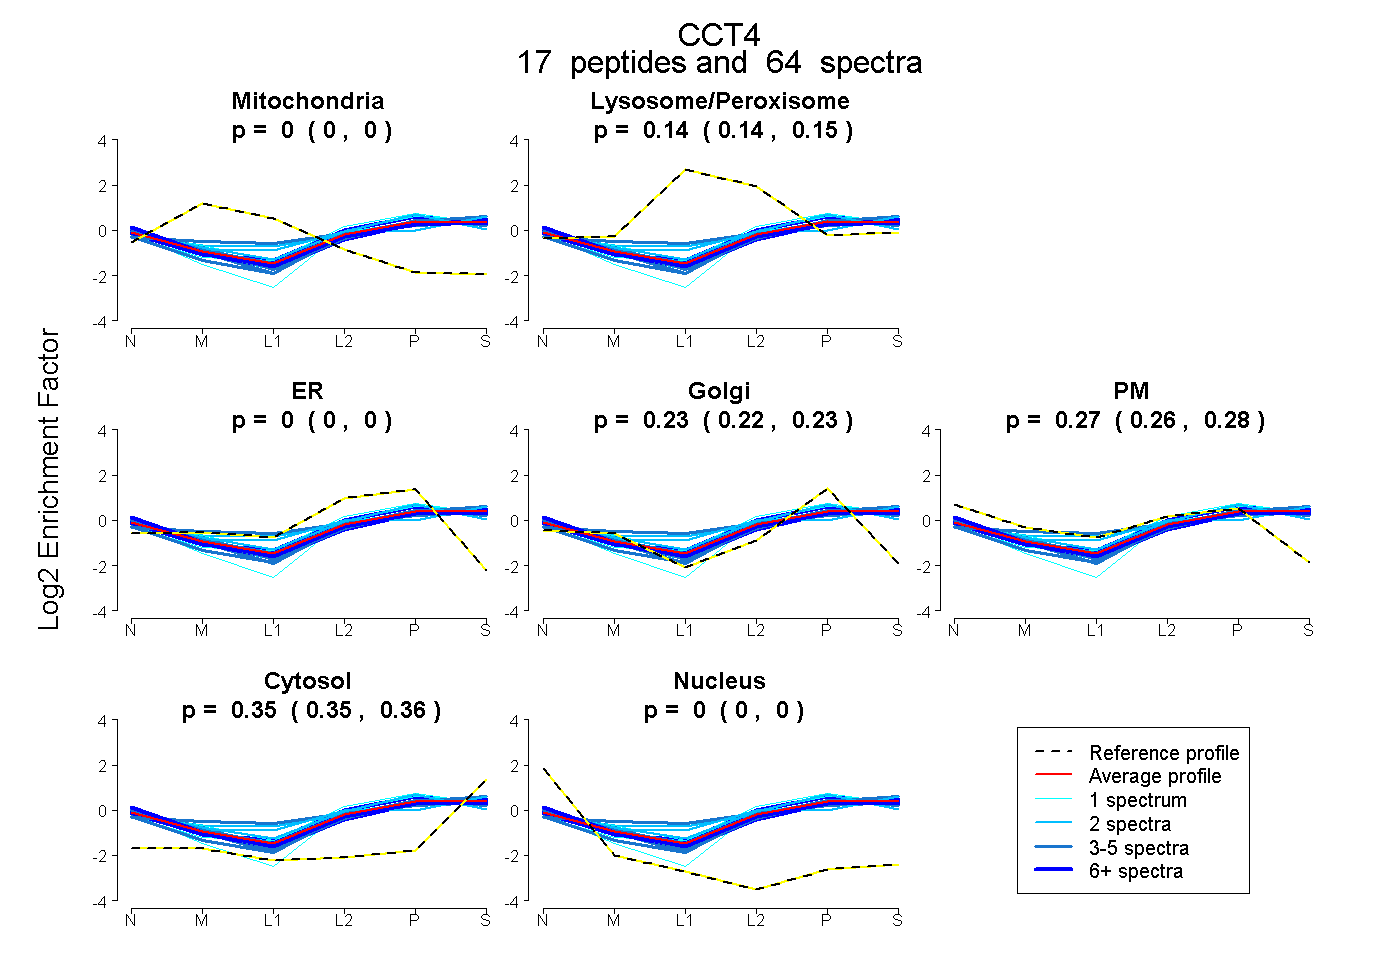
0.000 | 0.000
0.139 | 0.148
0.000 | 0.000
0.223 | 0.235
0.264 | 0.279
0.352 | 0.357
0.000 | 0.000
26peptides
spectra
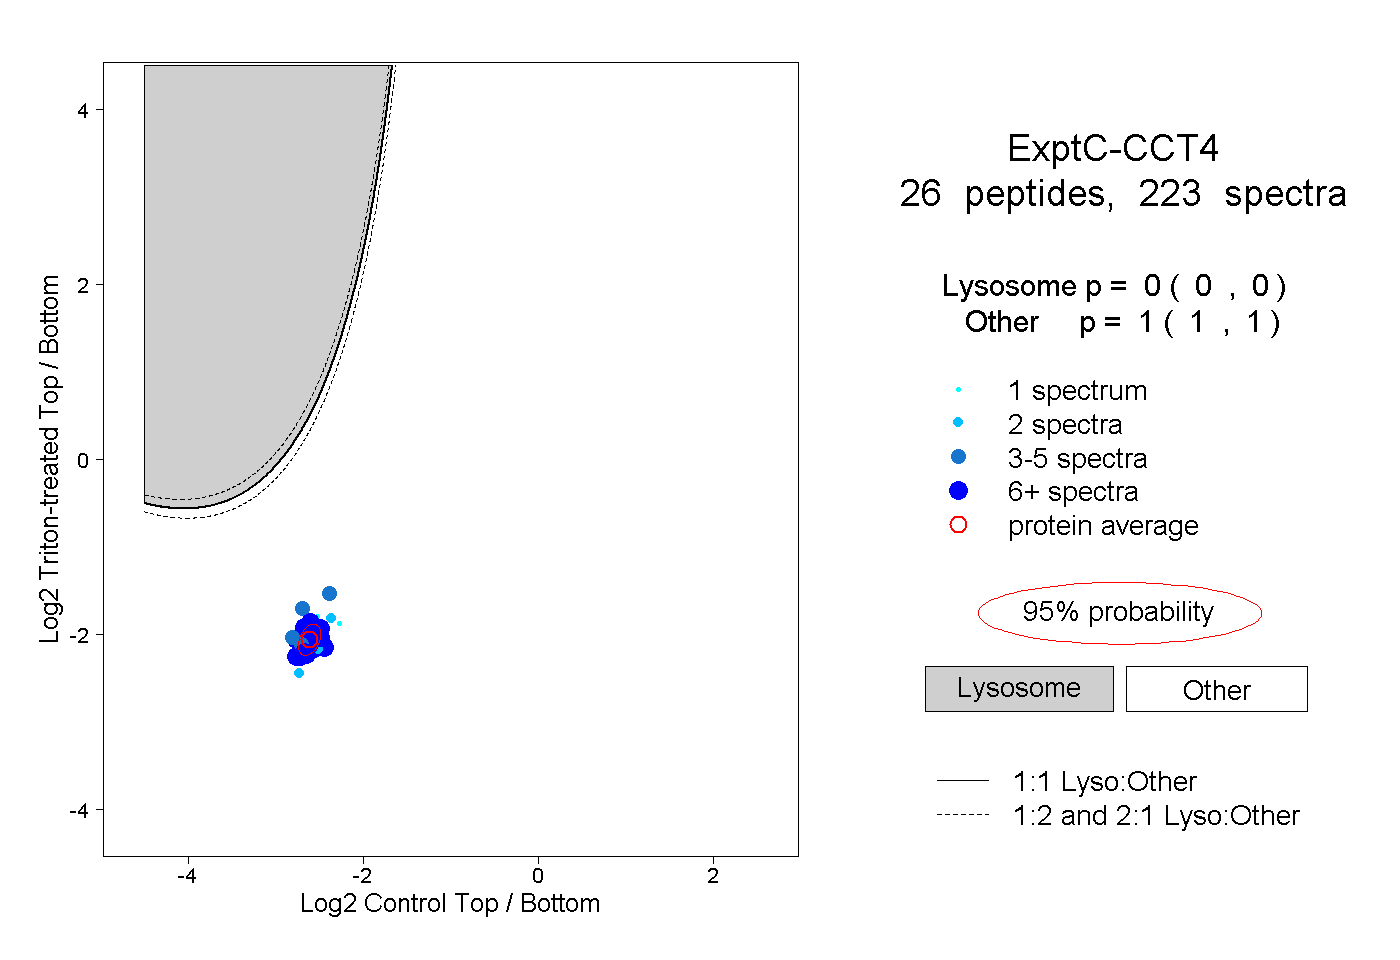
0.000 | 0.000
1.000 | 1.000
12peptides
spectra
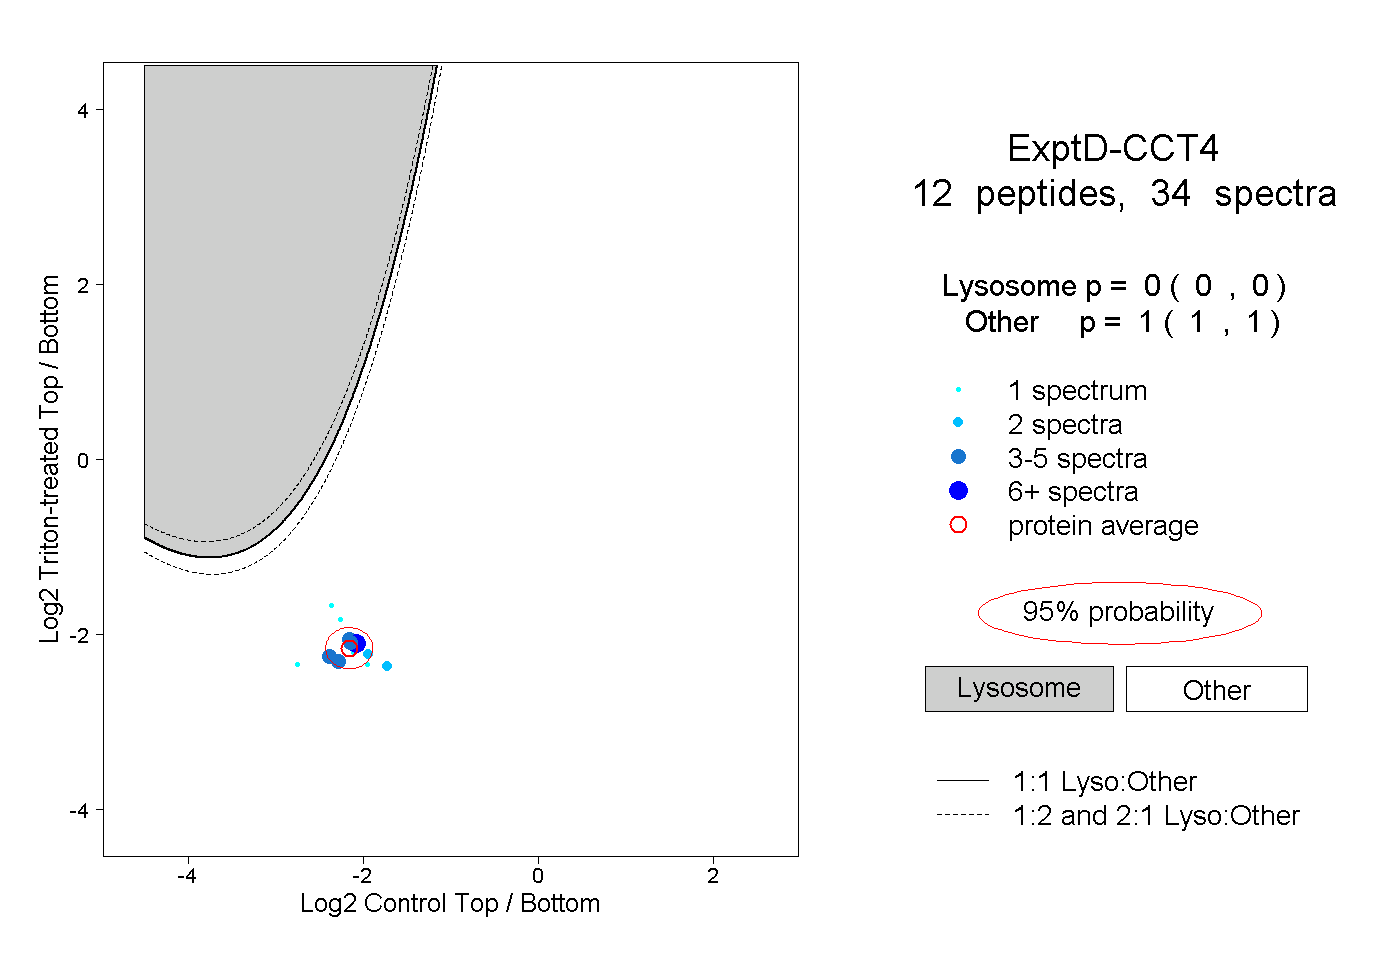
0.000 | 0.000
1.000 | 1.000