 3
3peptides
spectra
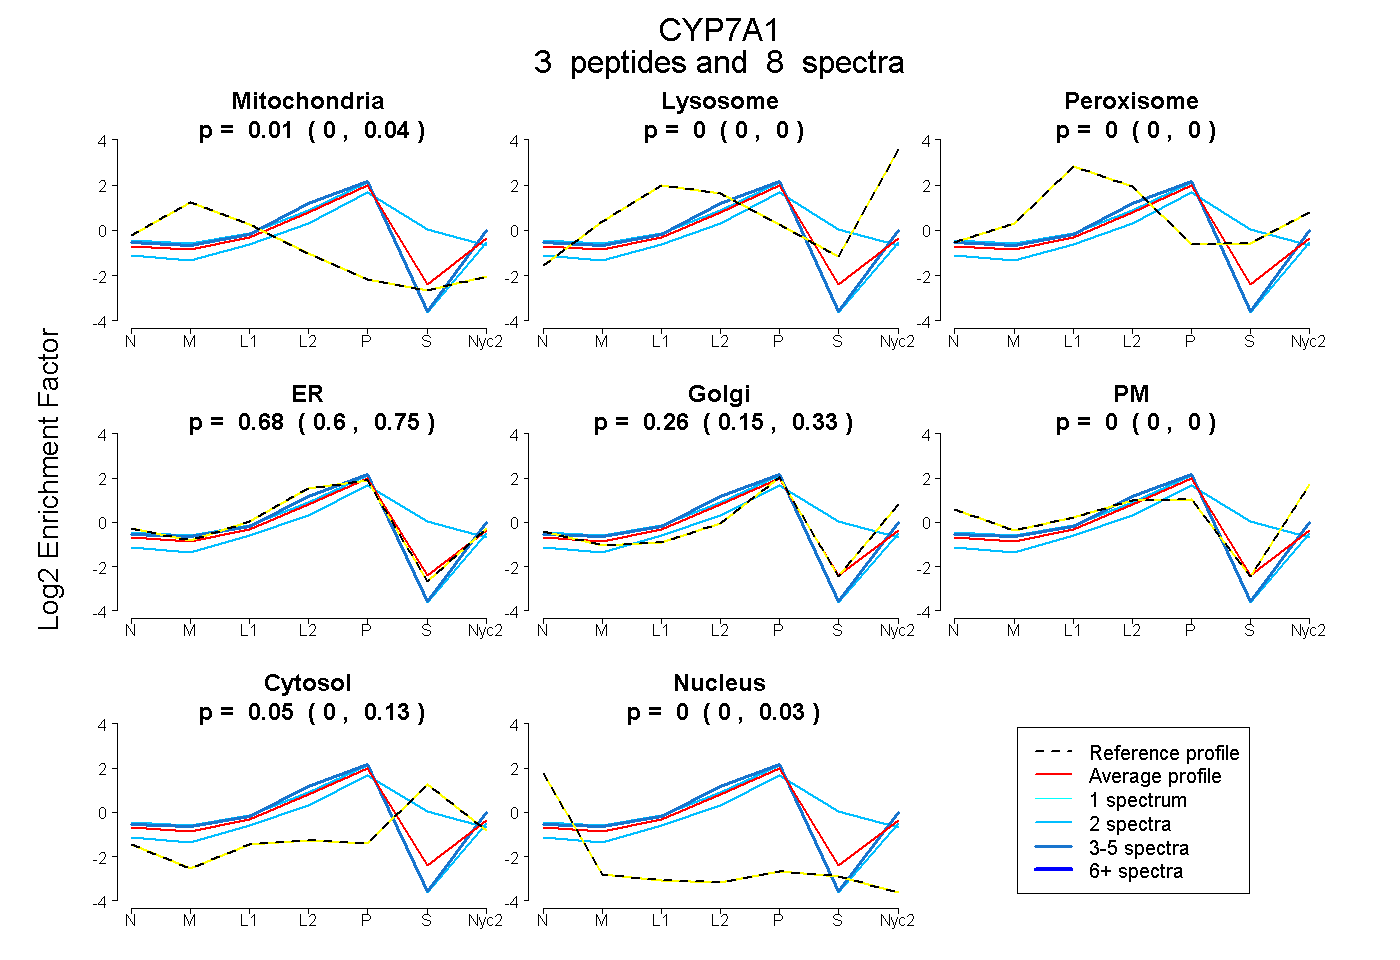
0.000 | 0.041
0.000 | 0.000
0.000 | 0.000
0.598 | 0.749
0.146 | 0.327
0.000 | 0.000
0.000 | 0.133
0.000 | 0.034
4peptides
spectra
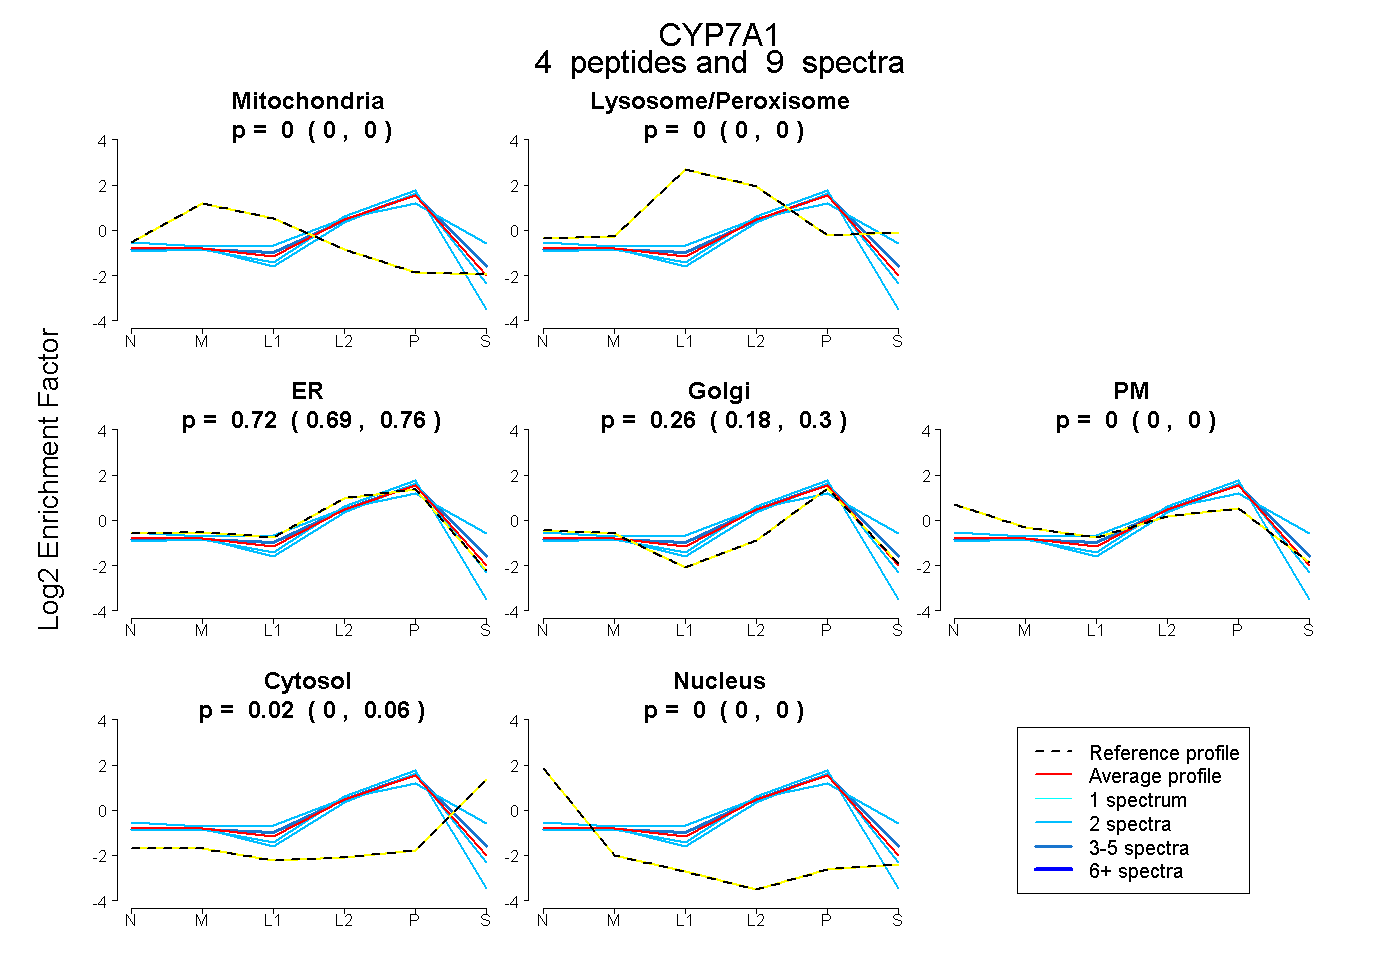
0.000 | 0.000
0.000 | 0.000
0.688 | 0.757
0.182 | 0.298
0.000 | 0.000
0.000 | 0.063
0.000 | 0.000
8peptides
spectra
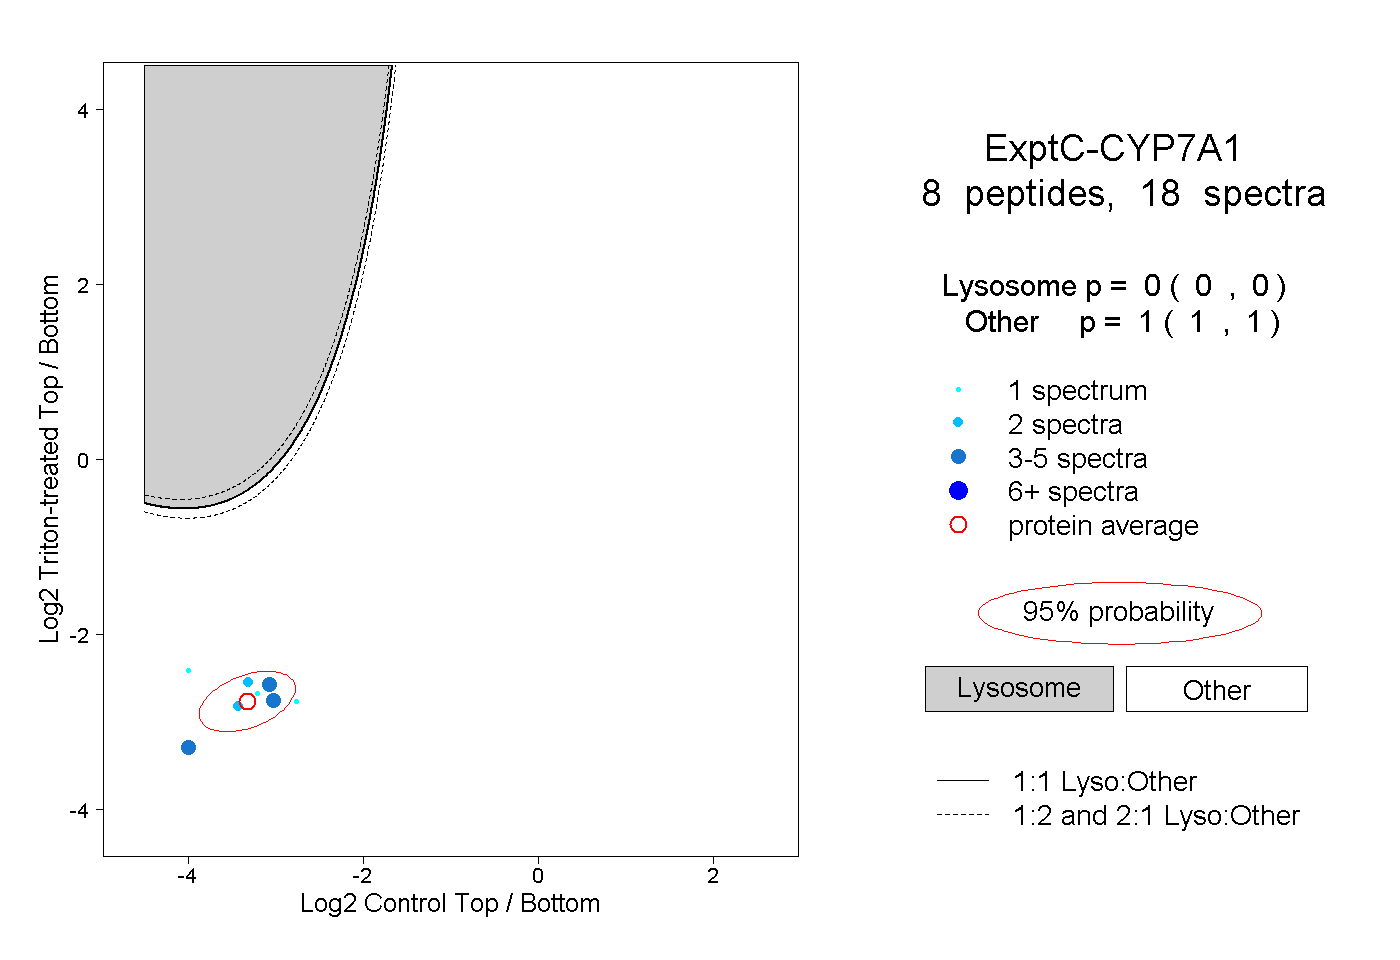
0.000 | 0.000
1.000 | 1.000
5peptides
spectra
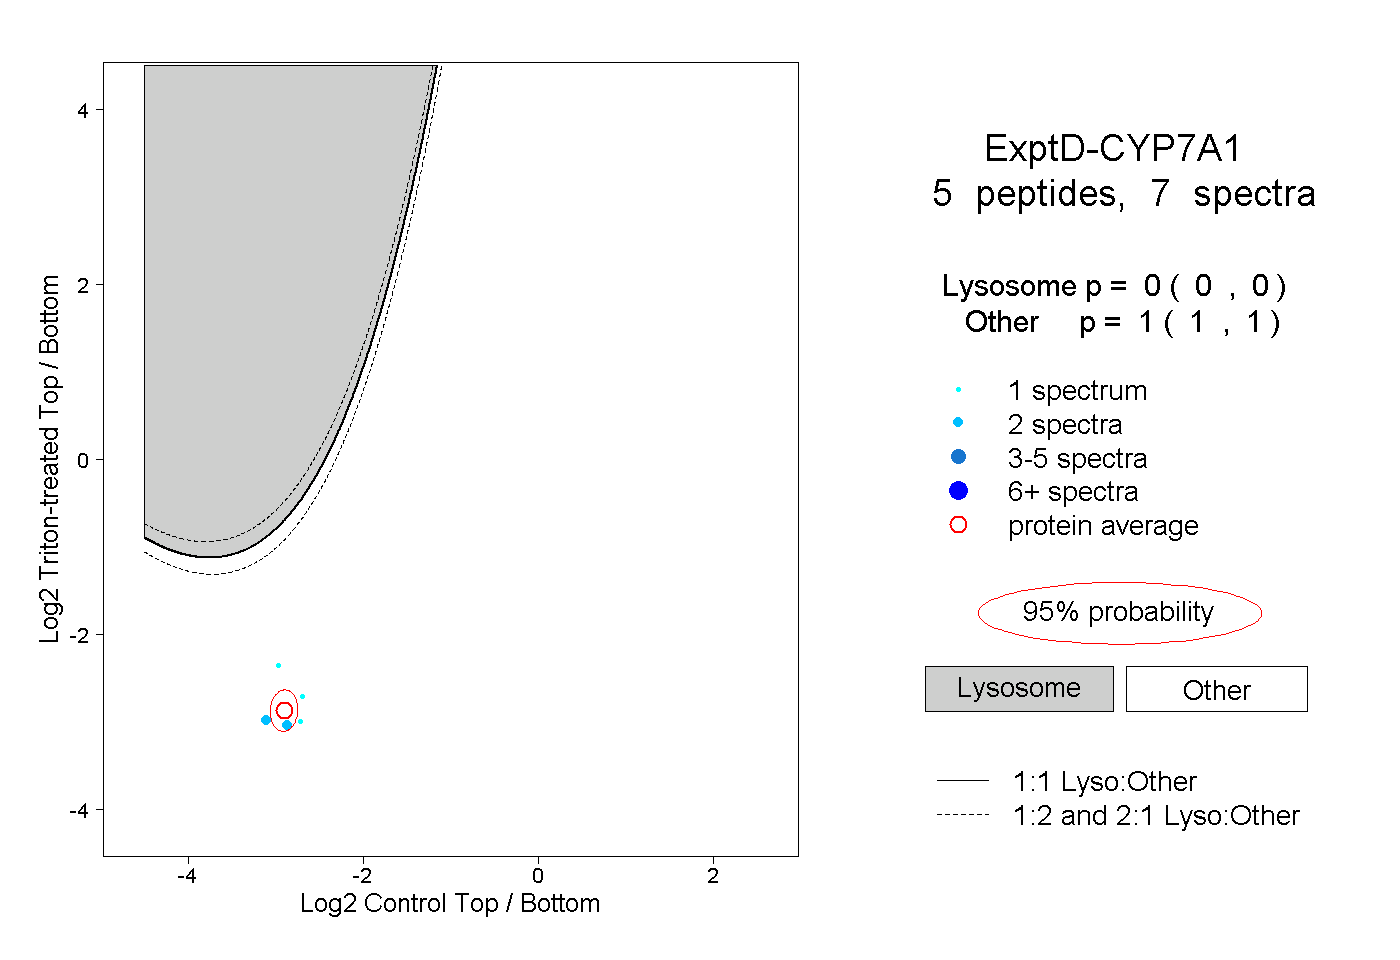
0.000 | 0.000
1.000 | 1.000