 3
3peptides
spectra
0.000 | 0.041
0.000 | 0.000
0.000 | 0.000
0.598 | 0.749
0.146 | 0.327
0.000 | 0.000
0.000 | 0.133
0.000 | 0.034
| Plot | Mito | Lyso | Perox | ER | Golgi | PM | Cytosol | Nucleus | |||||
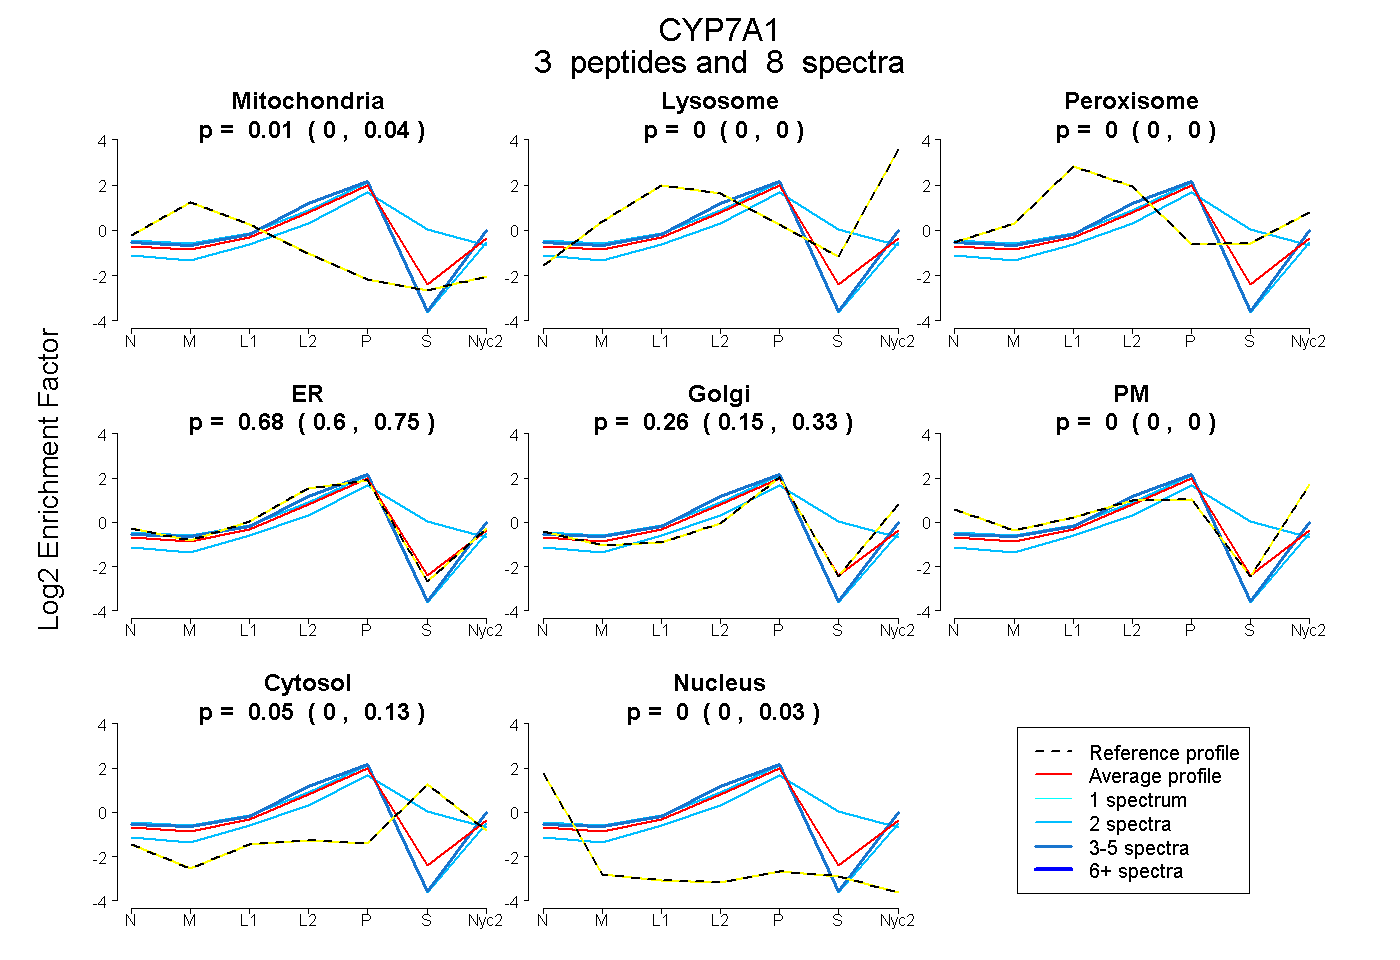
| Expt A |
3 peptides |
8 spectra |
|
0.013 0.000 | 0.041 |
0.000 0.000 | 0.000 |
0.000 0.000 | 0.000 |
0.675 0.598 | 0.749 |
0.260 0.146 | 0.327 |
0.000 0.000 | 0.000 |
0.052 0.000 | 0.133 |
0.000 0.000 | 0.034 |
| 2 spectra, DQVSELIR | 0.000 | 0.000 | 0.000 | 0.513 | 0.060 | 0.000 | 0.426 | 0.000 | ||
| 2 spectra, CPPLDQSR | 0.032 | 0.000 | 0.000 | 0.819 | 0.133 | 0.000 | 0.000 | 0.016 | ||
| 4 spectra, FGSNPLEFLR | 0.000 | 0.000 | 0.000 | 0.803 | 0.197 | 0.000 | 0.000 | 0.000 |
| Plot | Mito | Lyso or Perox | ER | Golgi | PM | Cytosol | Nucleus | ||||||
| Expt B |
4 peptides |
9 spectra |
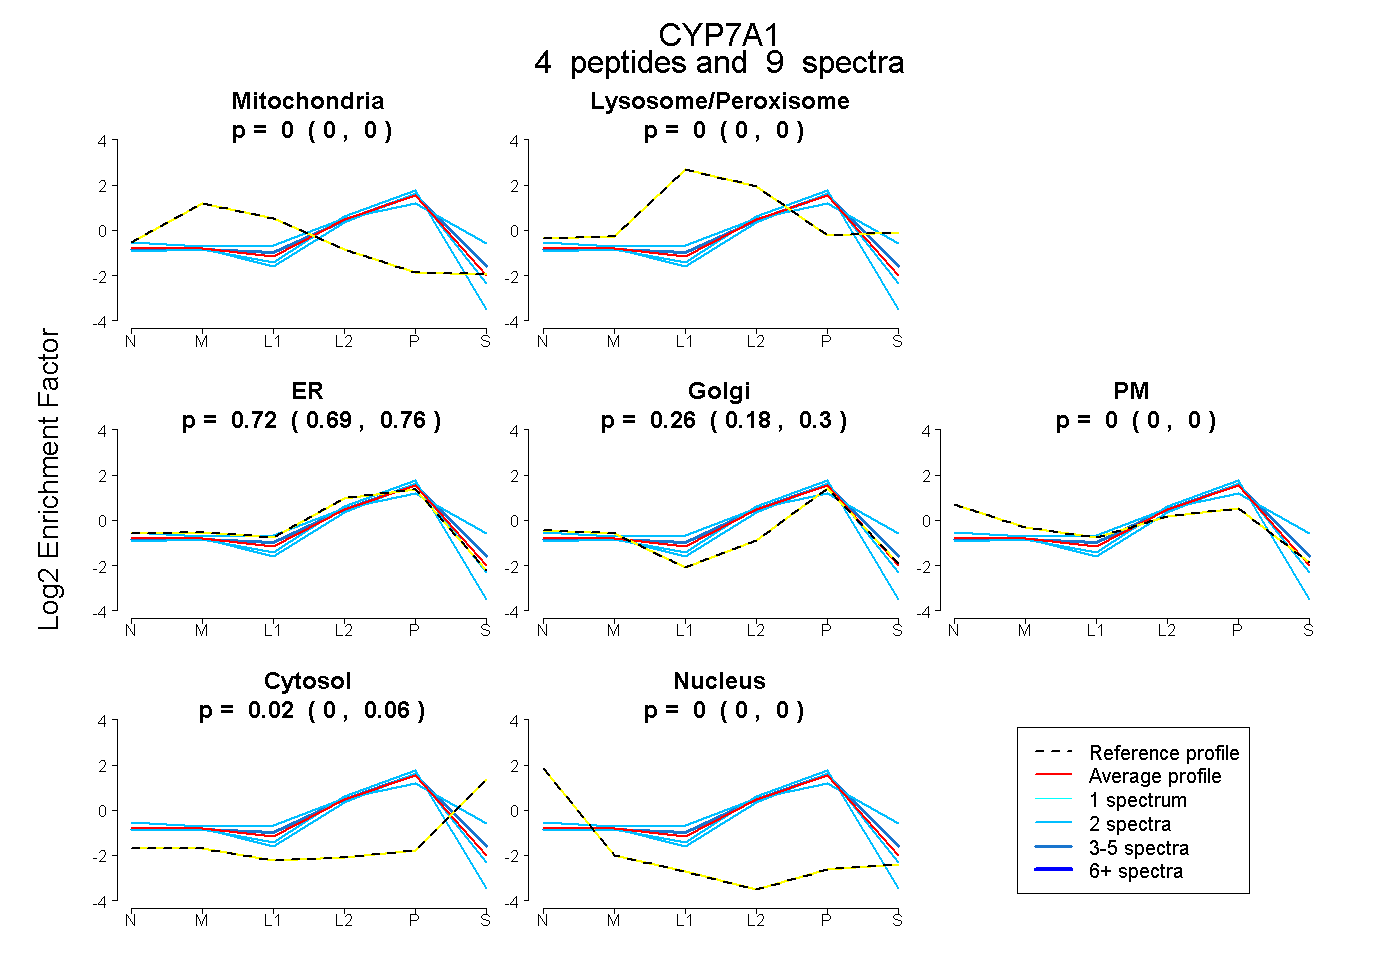 |
0.000 0.000 | 0.000 |
0.000 0.000 | 0.000 |
0.722 0.688 | 0.757 |
0.260 0.182 | 0.298 |
0.000 0.000 | 0.000 |
0.018 0.000 | 0.063 |
0.000 0.000 | 0.000 |
|||
| Plot | Lyso | Other | |||||||||||
| Expt C |
8 peptides |
18 spectra |
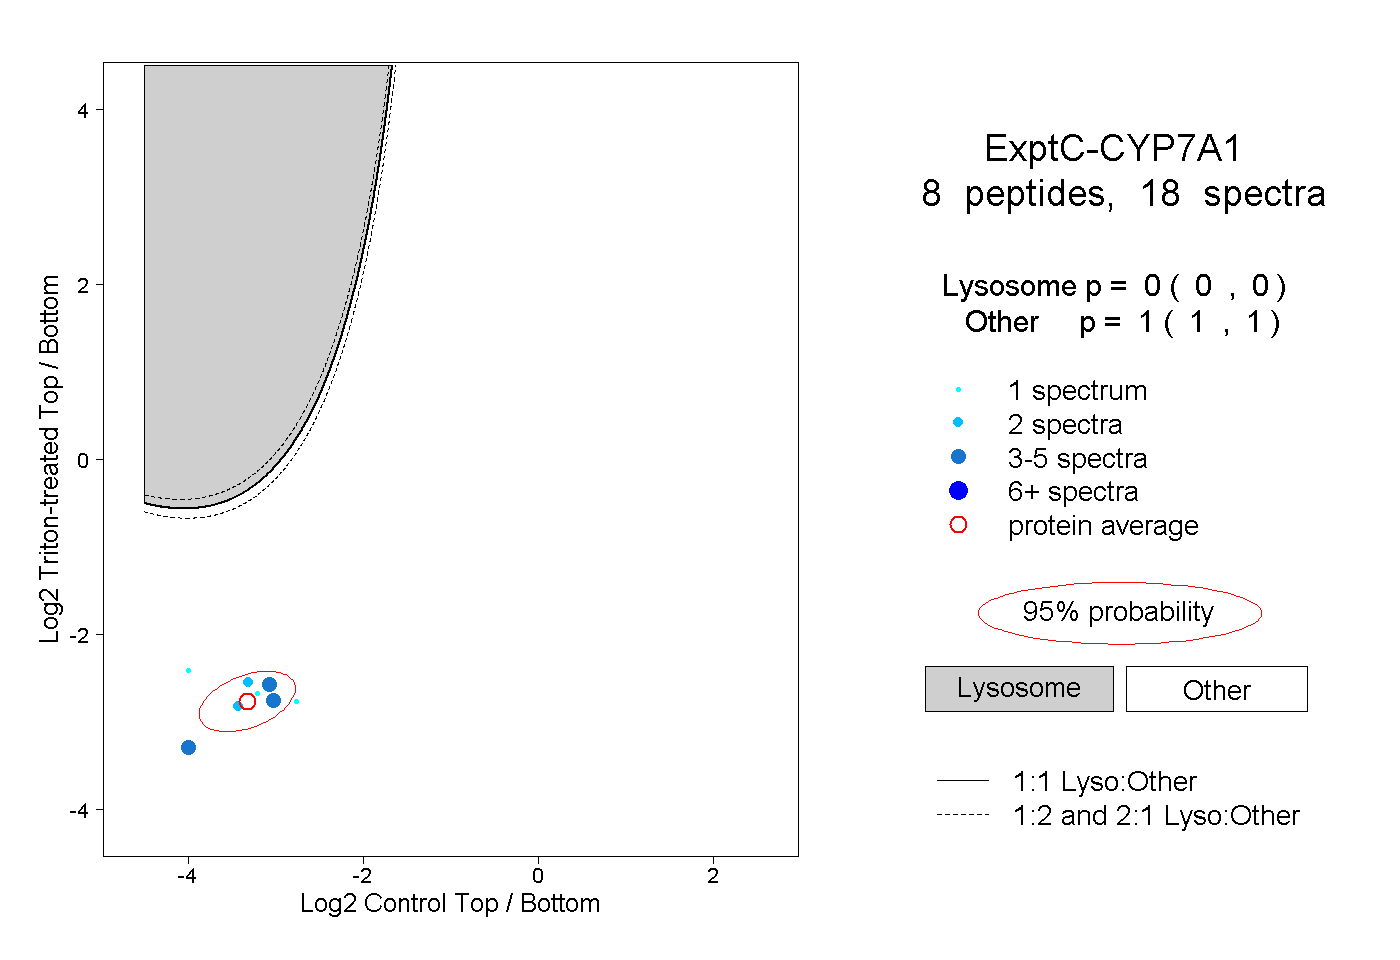 |
0.000 0.000 | 0.000 |
1.000 1.000 | 1.000 |
||||||||
| Plot | Lyso | Other | |||||||||||
| Expt D |
5 peptides |
7 spectra |
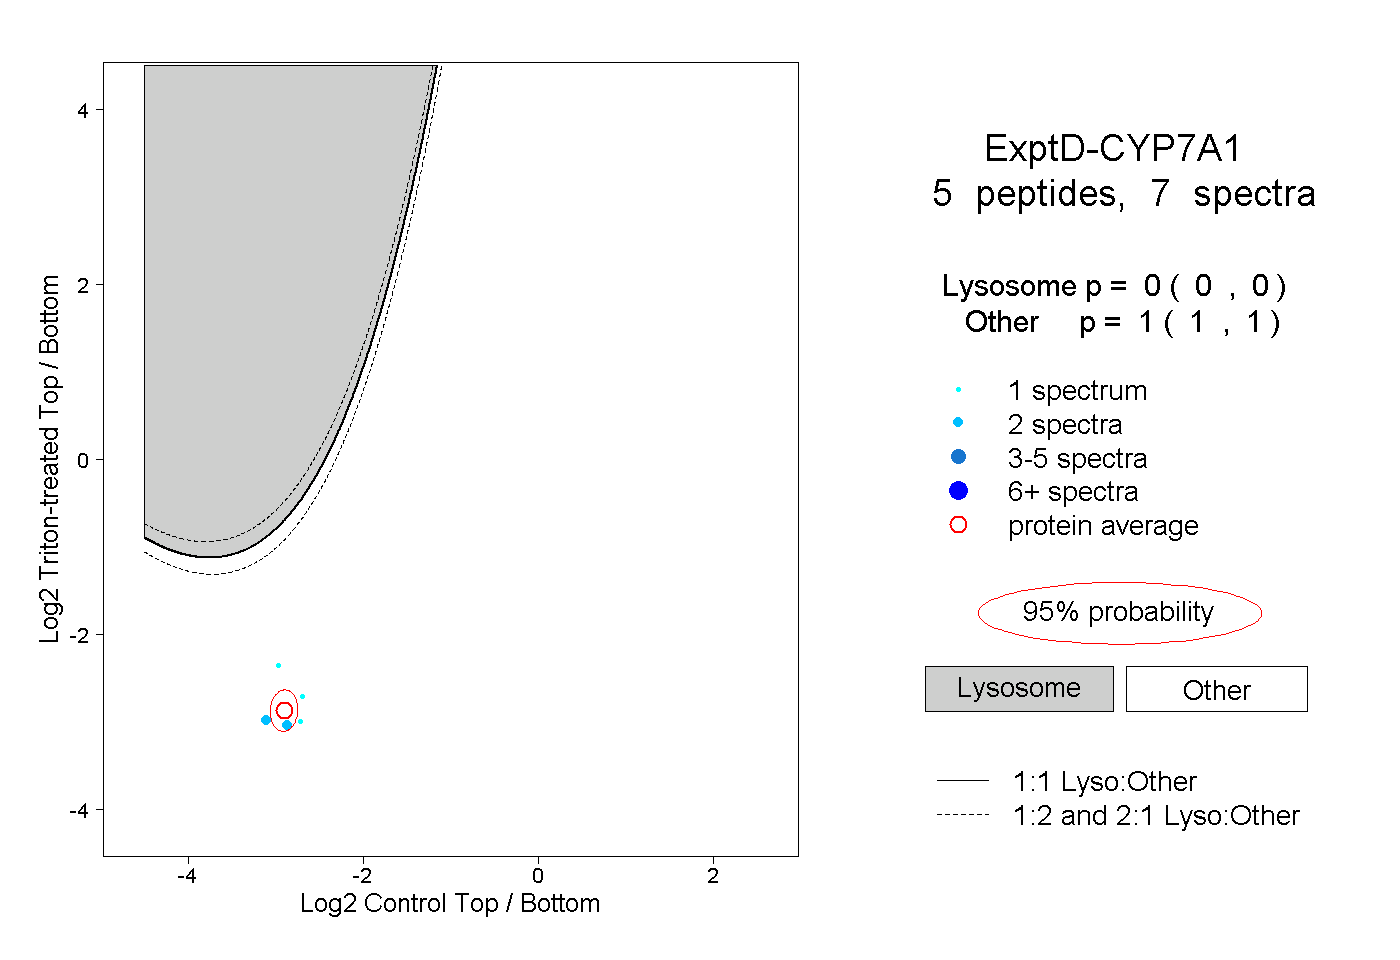 |
0.000 0.000 | 0.000 |
1.000 1.000 | 1.000 |