 7
7peptides
spectra
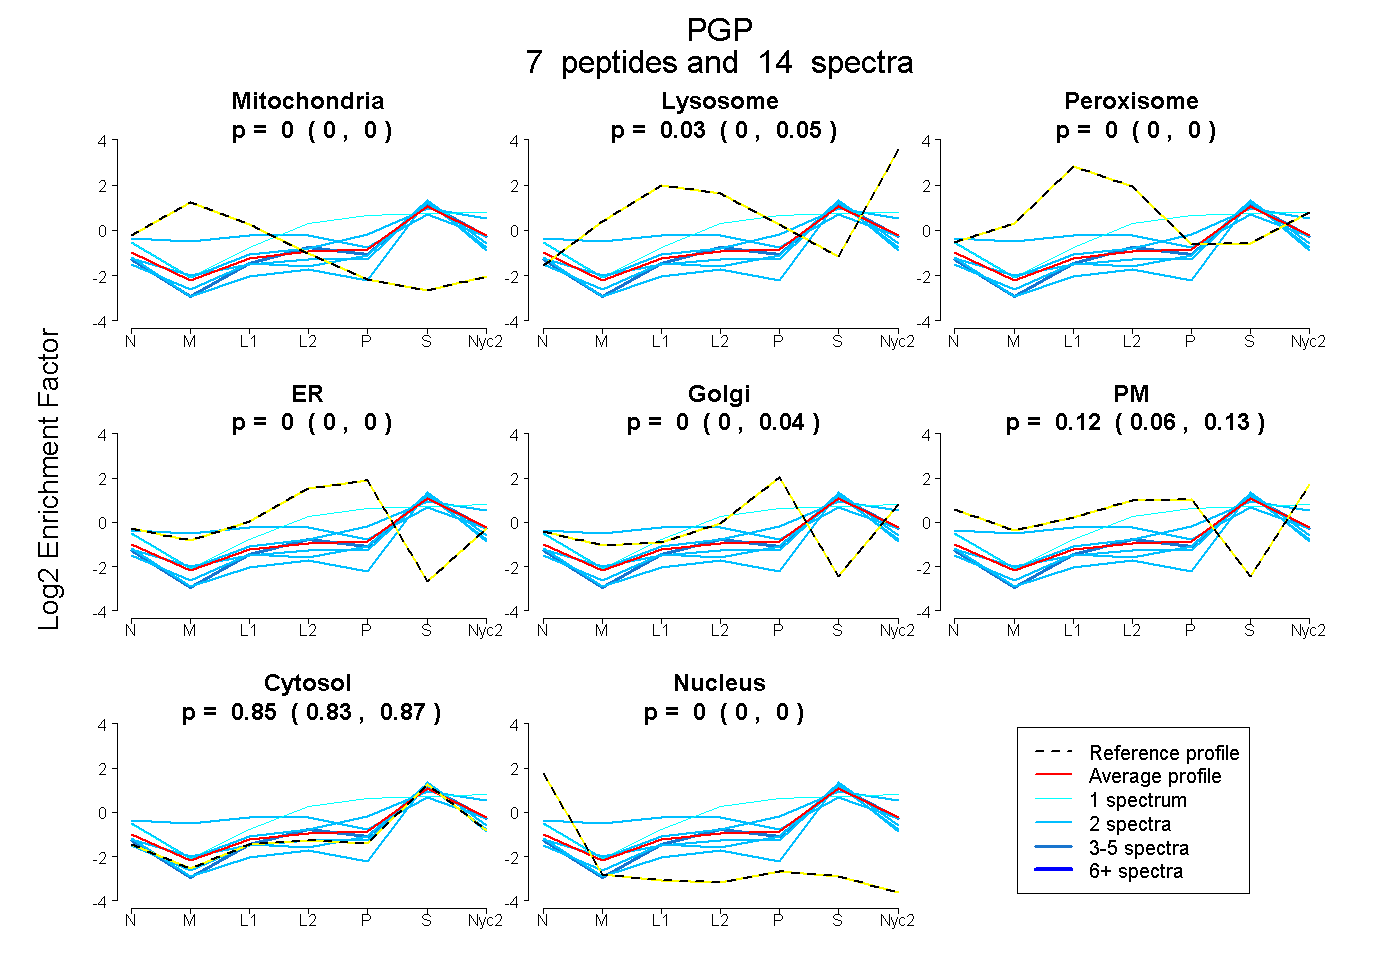
0.000 | 0.000
0.001 | 0.055
0.000 | 0.000
0.000 | 0.000
0.000 | 0.042
0.064 | 0.135
0.832 | 0.870
0.000 | 0.000
1peptide
spectrum
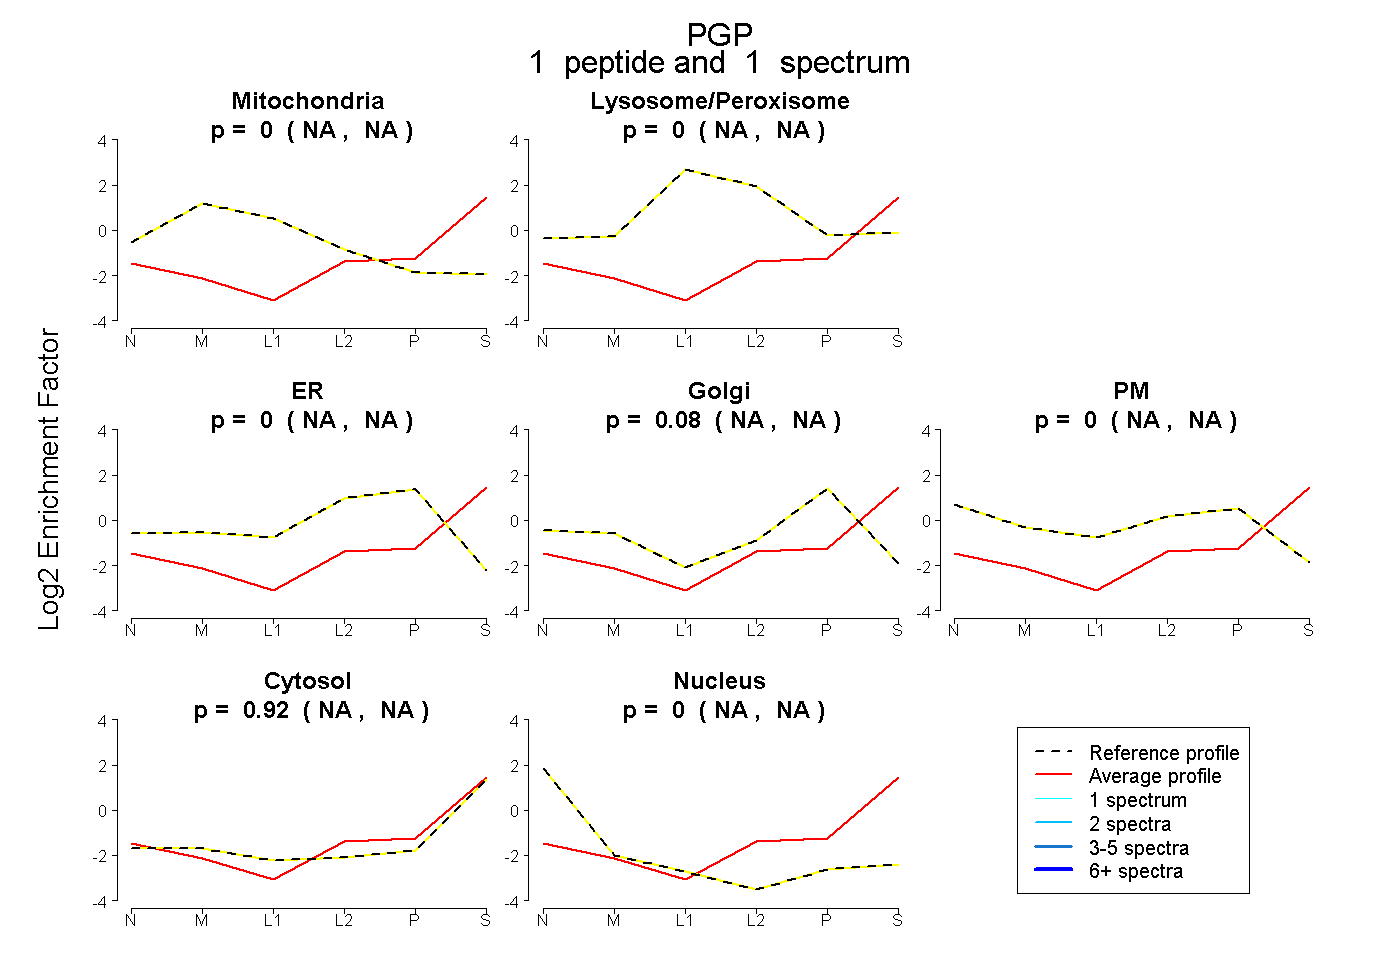
NA | NA
NA | NA
NA | NA
NA | NA
NA | NA
NA | NA
NA | NA
5peptides
spectra
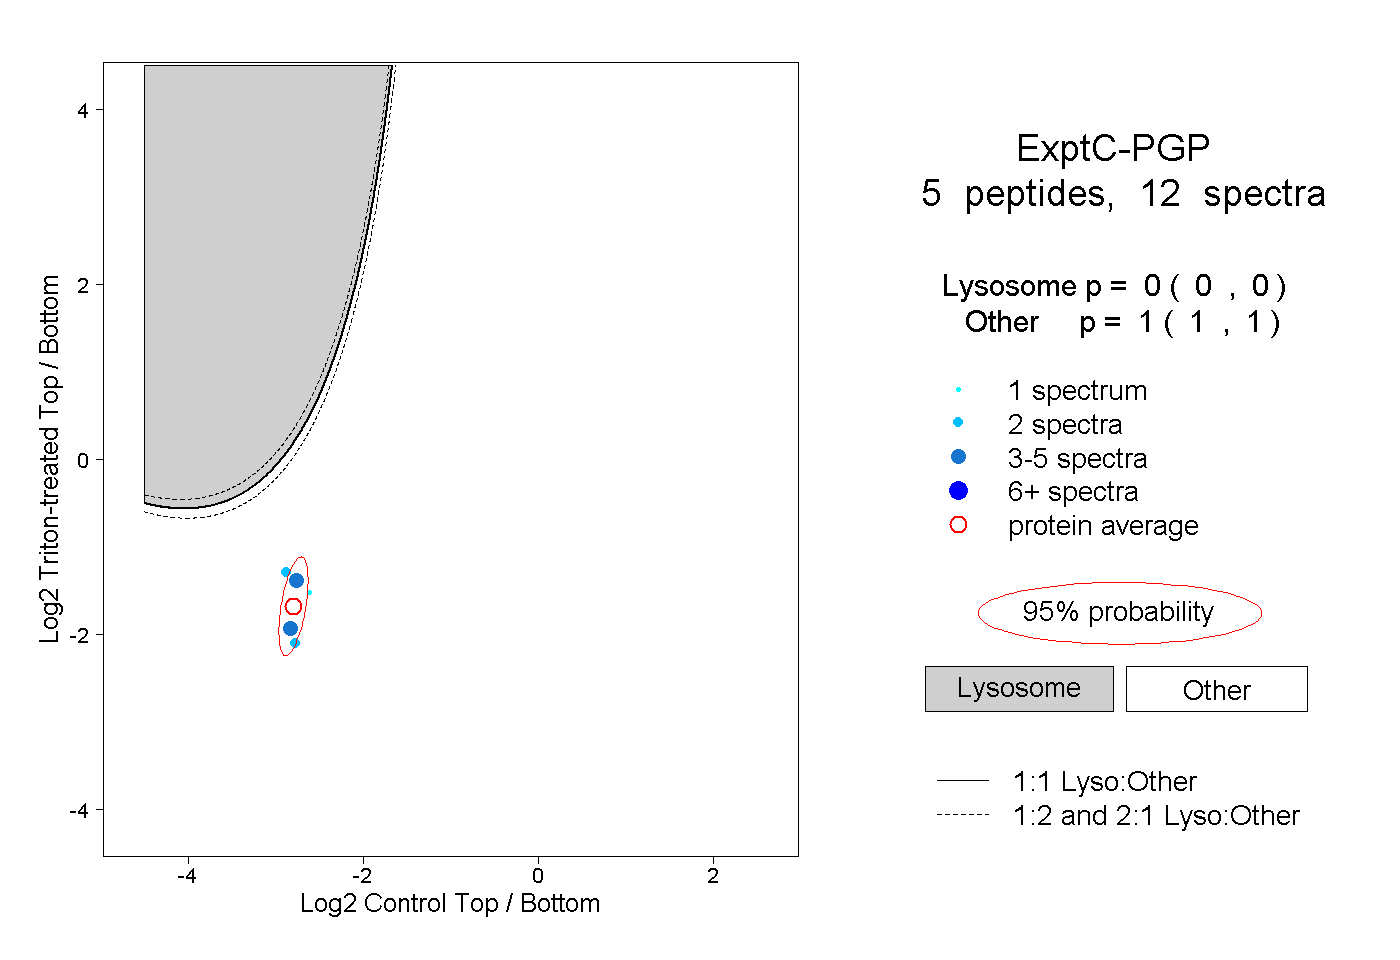
0.000 | 0.000
1.000 | 1.000
1peptide
spectrum
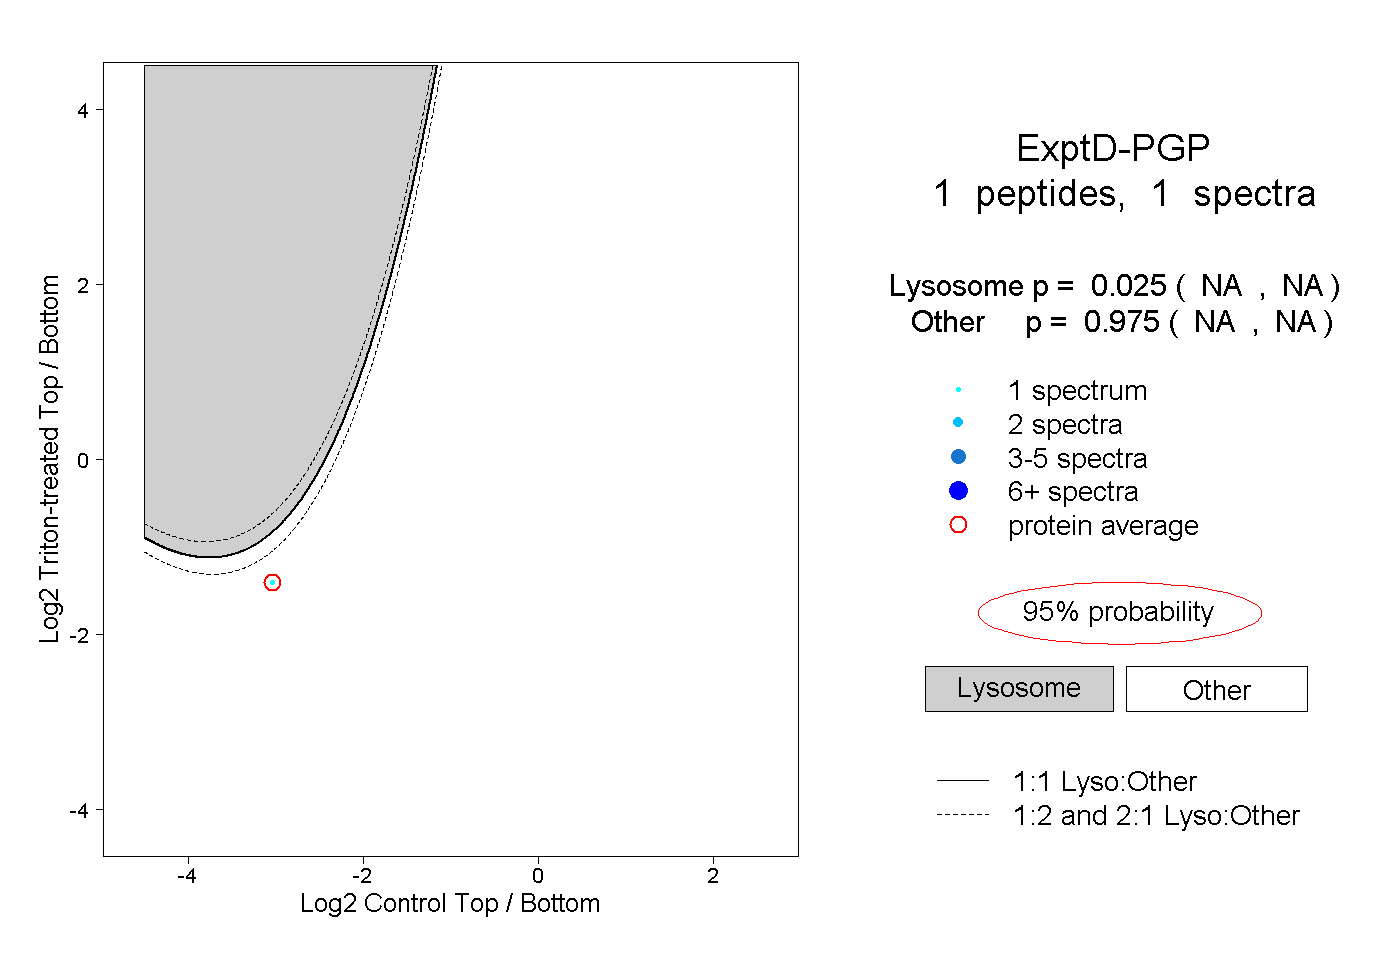
NA | NA
NA | NA